NVIDIA reported last night. The stock is down 1.78% today — well inside the 6.3% move the options market was pricing in.
That’s the print. Here’s the part that doesn’t make the headline.
At Volworks, we track the post-earnings drift on 800+ names — not just the reaction candle, but what the stock actually does over the next 7, 14, and 28 days. We do it because that’s where the statistical edge lives for the overlays our clients run on positions they already own. Covered calls, put writes, boosters — enhancement strategies, not trading strategies — only work when the math underneath them is real.
NVDA’s May cycle is a clean example.
The All-Cycle Average: A Coin Flip
Across all 40 NVDA earnings over the past 10 years:
A coin flip.
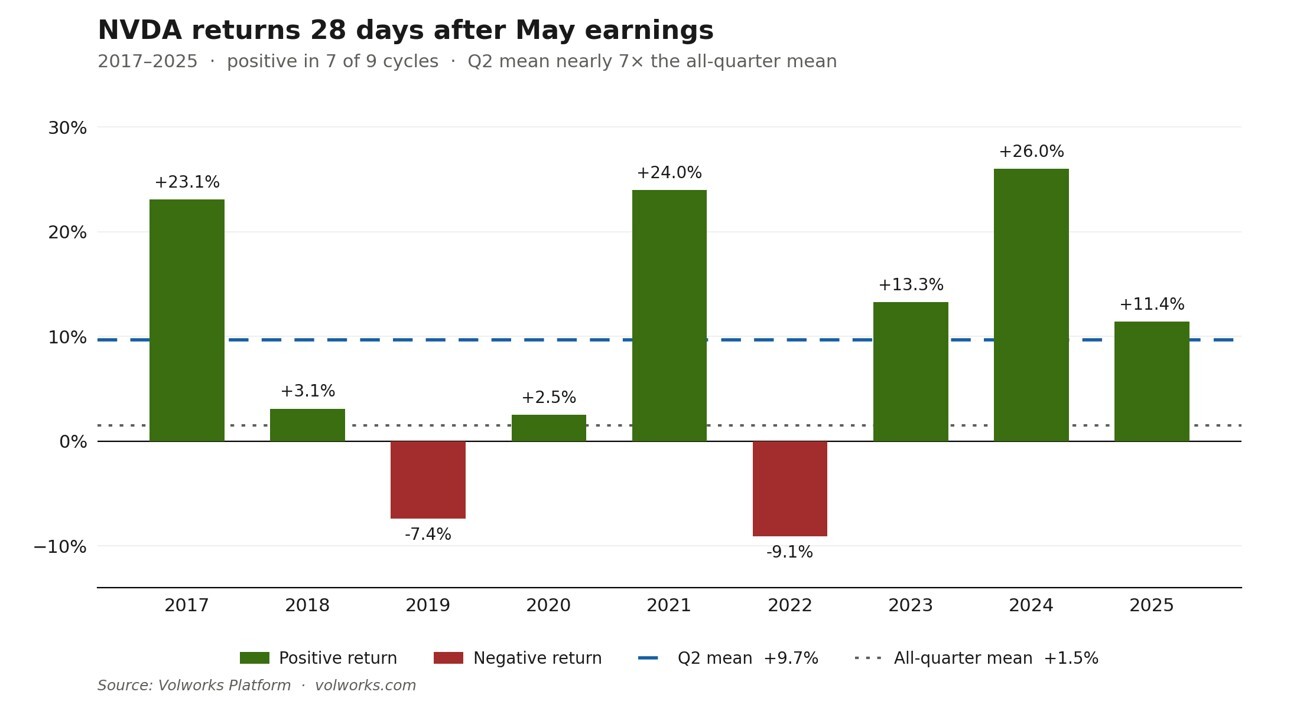
The May Cycle: A Different Story Entirely
Now narrow it to just the May cycle — the window we’re in right now:
7 of the past 9 May cycles have been green at +28 days — +13% in 2023, +26% in 2024, +11% in 2025. The reaction has been muted; the drift has been the trade.
What This Means for Advisors
For an advisor holding a long NVDA position, that asymmetry matters. It’s the difference between writing covered calls into expected strength, putting on a booster ahead of a likely run, or doing nothing at all. We model the overlay that fits each setup — and we run this same analysis on every name we cover.
“The reaction candle is noise. The drift is where advisors running options overlays actually make their decisions.”
— Victor Viner, Founder & CEO, Volworks
If you’re managing options overlays across client accounts and you’re not tracking post-earnings drift by cycle, you’re leaving a significant input off the table. That’s the data layer Volworks was built to surface.