Alphabet fell (7.1%) following its earnings release today — the largest Q3 earnings day decline in the last 10 years. For advisors holding positions, the earnings day move is only part of the story. At Volworks, we track post-earnings drift across 800+ names — what the stock does in the 28 days that follow. The data for GOOGL’s Q3 cycle tells a more cautionary story than most.
The Q3 Drift Pattern
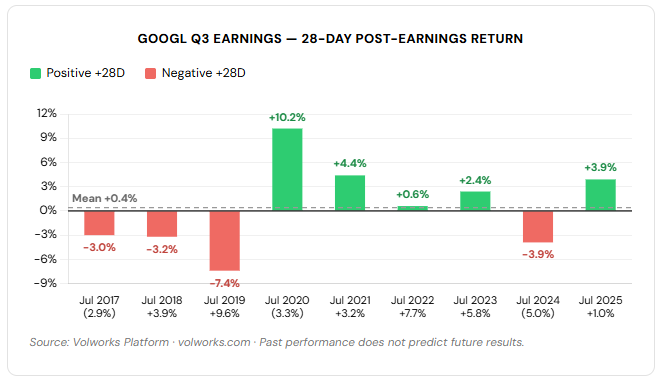
Across the 9 prior Q3 earnings events with complete data over the last 10 years, GOOGL has produced a positive 28-day return in just 5 out of 9 instances, with returns ranging from (7.4%) to +10.2%. The mean +28 day return is only +0.4%.
Mixed 28-day drift across Q3 — no consistent direction regardless of earnings day move.
GOOGL Q3 Earnings — 28-Day Post-Earnings Return
Source: Volworks Platform · volworks.com · Past performance does not predict future results.
When GOOGL Moves Lower on Earnings Day
Narrowing to the 3 prior instances where GOOGL declined on Q3 earnings day, the +28 day drift has been mixed: two of three prior Q3 down events were still lower at +28 days; only 2020 recovered.
Only 1 of 3 prior Q3 down events produced a positive return at +28 days.
Today’s (7.1%) decline is the largest Q3 earnings day drop on record (10 Years) — the prior worst was (5.0%) in July 2024, which was followed by a (3.9%) return at +28 days.
GOOGL — Post-Earnings Performance, Q3 Down Events
| Date | Earnings Day | +28 Days |
|---|---|---|
| Jul 2024 | (5.0%) | (3.9%) |
| Jul 2020 | (3.3%) | +10.2% |
| Jul 2017 | (2.9%) | (3.0%) |
| Source: Volworks Platform · 3 Q3 down events for GOOGL over 10 years. | ||
Implications for Advisors
GOOGL’s Q3 down-event history does not show the same recovery pattern seen in other names after a decline. Two of the three prior Q3 down events kept drifting lower over the following month, and the broader all-quarter down-day sample (19 events, 10 years) tells the same story: only 38.9% recover by +28 days, with a mean drift of (0.9%) — versus 66.7% recovery and a +1.5% mean after up-day events.
- Advisors holding long GOOGL positions should not assume a quick bounce-back over the next 30 days. The historical bias after a down earnings print leans toward continuation, not reversal.
Disclosures: This article is for educational purposes only and does not constitute investment advice or a recommendation to buy or sell any specific security. Options involve risk and are not suitable for all investors. Past performance is not indicative of future results.