Tesla fell (14.5%) following its earnings release today — the largest Q3 earnings day decline in the last 10 years. For advisors holding positions, the earnings day move is only part of the story. At Volworks, we track post-earnings drift across 800+ names — what the stock does in the 28 days that follow. The data for TSLA’s Q3 cycle is instructive.
The Q3 Drift Pattern
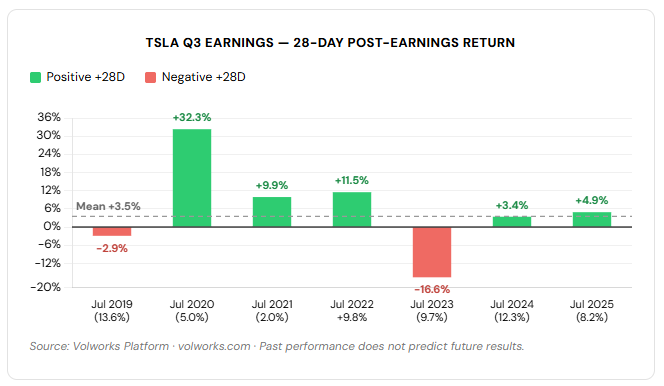
Across all 10 Q3 earnings events over the last 10 years, TSLA has produced a positive 28-day return in 6 of 9 completed instances — regardless of whether the stock rose or fell on earnings day. The mean +28 day return is +3.5%.
Positive 28-day drift in two-thirds of Q3 events, regardless of earnings day direction.
TSLA Q3 Earnings — 28-Day Post-Earnings Return
Source: Volworks Platform · volworks.com · Past performance does not predict future results.
When TSLA Moves Lower on Earnings Day
Narrowing to the 6 prior instances where TSLA declined on Q3 earnings day, the +28 day drift has been positive in 4 of 6 cases, with a mean return of +5.2%.
4 of 6 prior Q3 down events produced positive returns at +28 days.
Today’s (14.5%) decline is the largest Q3 earnings day drop on record (10 Years) — the prior worst was (13.6%) in July 2019, which was followed by a (2.9%) return at +28 days.
TSLA — Post-Earnings Performance, Q3 Down Events
| Date | Earnings Day | +28 Days |
|---|---|---|
| Jul 2019 | (13.6%) | (2.9%) |
| Jul 2020 | (5.0%) | +32.3% |
| Jul 2021 | (2.0%) | +9.9% |
| Jul 2023 | (9.7%) | (16.6%) |
| Jul 2024 | (12.3%) | +3.4% |
| Jul 2025 | (8.2%) | +4.9% |
| Source: Volworks Platform · 6 Q3 down events for TSLA over 10 years. | ||
Implications for Advisors
The historical data leans positive: TSLA has drifted higher at +28 days in two-thirds of Q3 down events. But the closest comp to today’s size — 2019’s then-record (13.6%) decline — did not recover.
- Advisors holding long TSLA positions should weigh the ~67% historical recovery odds against a wide range of outcomes — (16.6%) to +32.3% — rather than assuming a bounce is likely.
- Given today’s move is larger than any prior Q3 comp, defined-risk structures or reduced position size may be more appropriate than a straight long hold over the next 28 days.
Disclosures: This article is for educational purposes only and does not constitute investment advice or a recommendation to buy or sell any specific security. Options involve risk and are not suitable for all investors. Past performance is not indicative of future results. Probability estimates are model outputs based on historical data and are not guarantees.