Walmart fell 7.3% after earnings this week — materially larger than the 4.4% implied move priced by the options market.
Most post-earnings commentary stops there.
At Volworks, we study something different: what stocks historically did after the earnings reaction. Not just the earnings-day move itself, but what happened 7 days later, 14 days later, and 28 days later — because for advisors and investors managing existing positions, the post-earnings behavior can matter more than the print itself.
We’re less interested in predicting earnings reactions than understanding what historically happened after them.
Here’s what stood out in the Walmart data.
The All-Cycle Picture
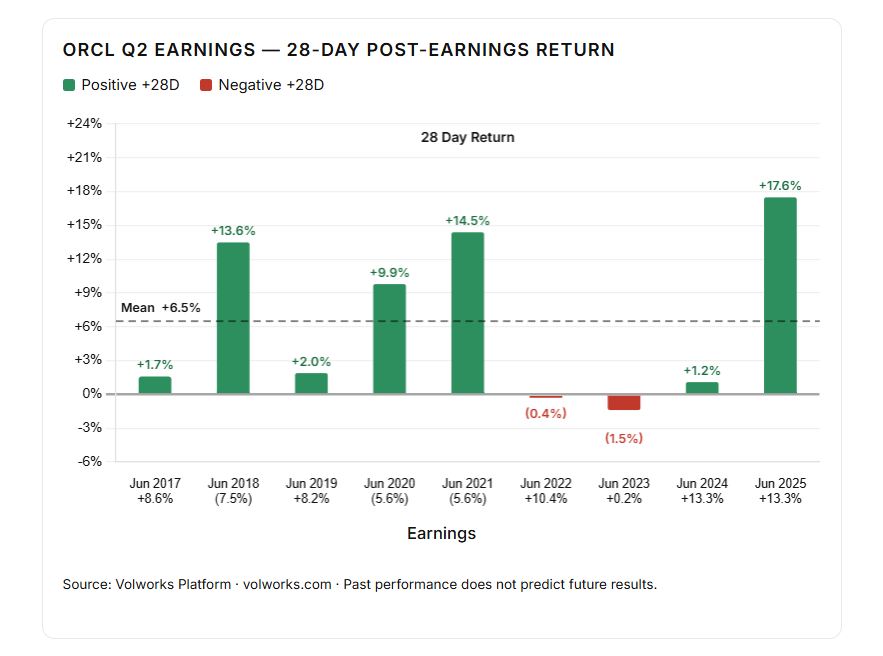
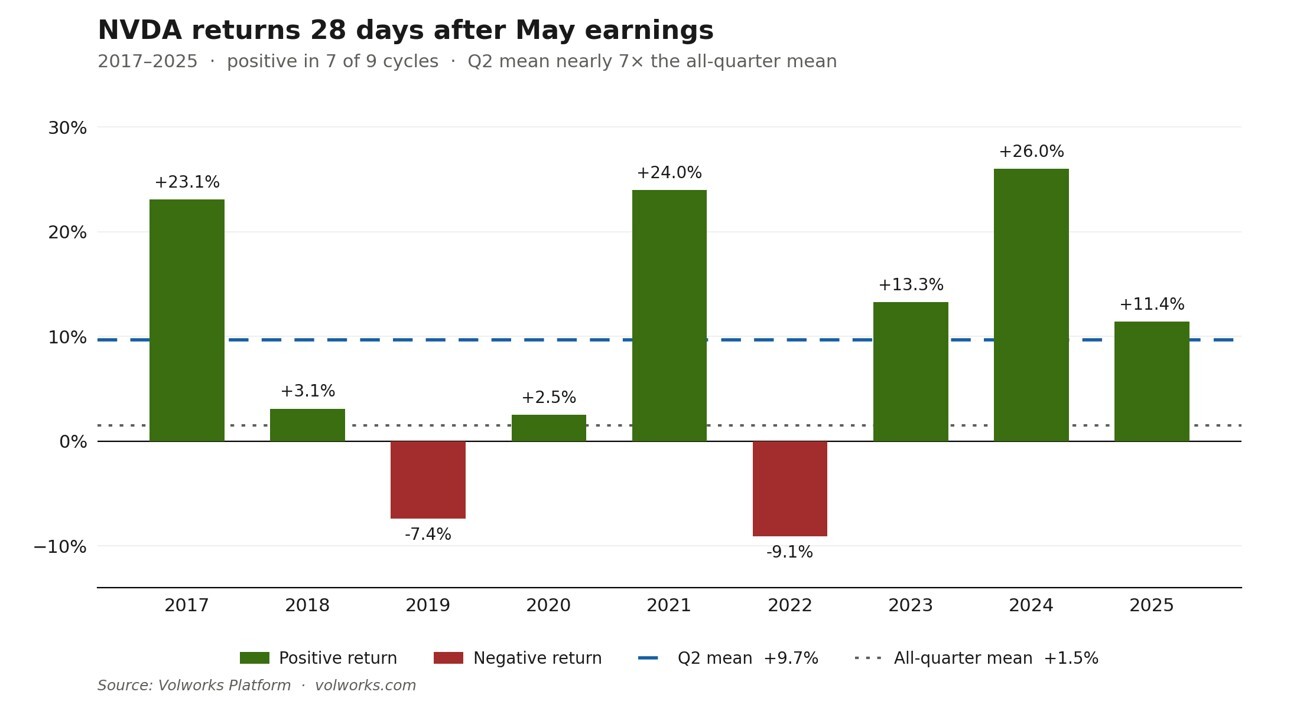
Across 40 earnings events over the last decade, Walmart’s average post-earnings returns were fairly mixed — consistent with what we see across most large-cap names when you aggregate all cycles. That aggregation, however, can mask meaningful seasonal patterns.
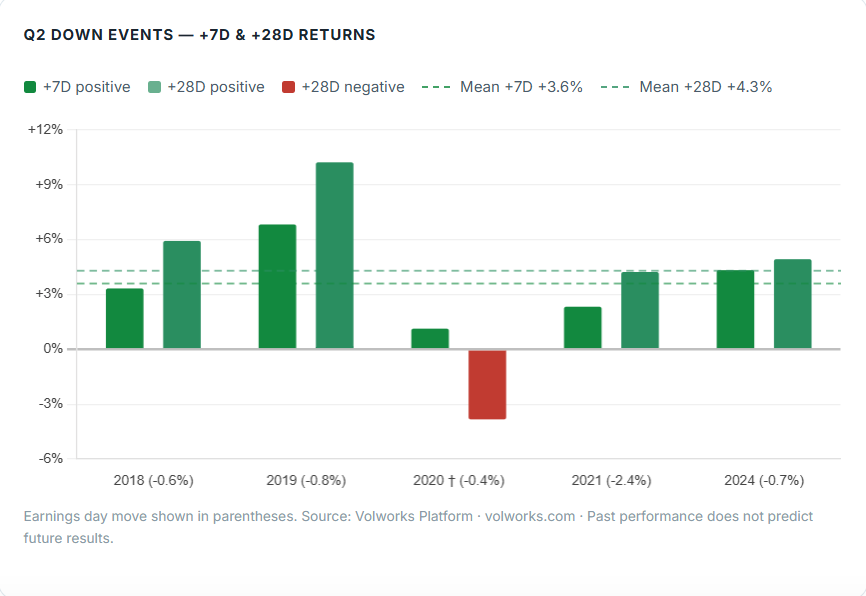
The Q2 Pattern: Every Negative Reaction Led to More Weakness
When isolating Q2 earnings cycles — the same cycle as the current release — a more interesting pattern emerged.
Every time Walmart was negative immediately after a Q2 earnings release, the stock was also negative 28 days later. That includes May 2020, May 2022, May 2025, and the current May 2026 event.
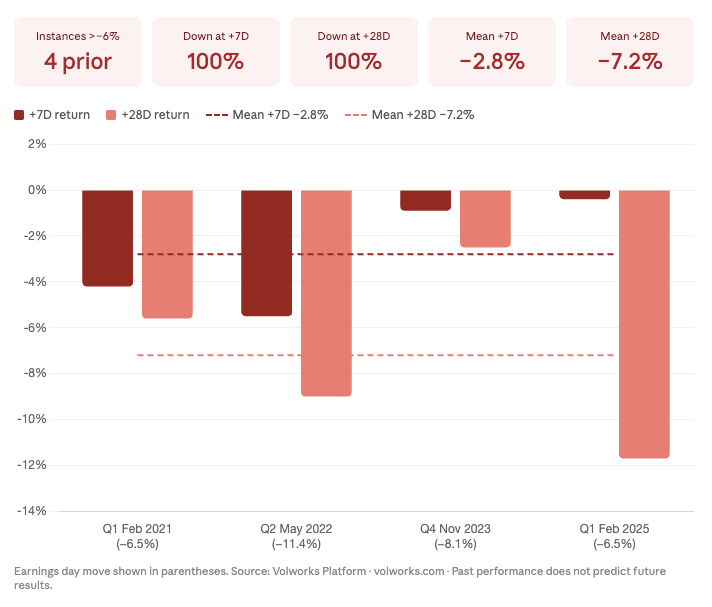
When the initial earnings decline exceeded roughly 6%, the historical weakness became even more pronounced:
| Event | Earnings Day | +7 Days | +28 Days |
|---|---|---|---|
| Feb 2021 | −6.5% | −4.2% | −5.6% |
| May 2022 | −11.4% | −5.5% | −9.0% |
| Nov 2023 | −8.1% | −0.9% | −2.5% |
| Feb 2025 | −6.5% | −0.4% | −11.7% |
Across those prior events:
- The stock was lower 7 days later every time
- The stock was lower 28 days later every time
- Average 28-day return: −7.2%
What This Means for the Earnings Analysis Framework
That doesn’t mean the pattern will repeat this time.
But it does highlight why we believe earnings analysis shouldn’t stop at beat vs. miss, implied vs. actual move, or the first-day reaction. The more interesting question is often:
What historically happened after the reaction?
That’s where post-earnings positioning, overlays, and active management decisions become relevant for advisors and investors already holding the stock.