Accenture generates 1.5% for a 31-day call with 11% of room before the cap. On most screens, that is one of the trades of the week. On ours, it rates two stars out of five, and we would not write it. The difference is everything the premium does not tell you.
Most covered call screens answer one question: which call generates the most? It sounds like the right question. It usually is not. Premium is the market’s price for expected movement, so a screen sorted by premium pushes the most volatile names to the top of the list. Sometimes that is a stock with an earnings report coming. More often, right now, it is a stock that has already moved a long way and is still moving. Those are the names where a cap costs you the most.
This week I did something simple to show it. I ran our covered call screen the way we always run it, then went looking for the names at the bottom of the rating, and asked what the premium was hiding.
From 1,000 names to five
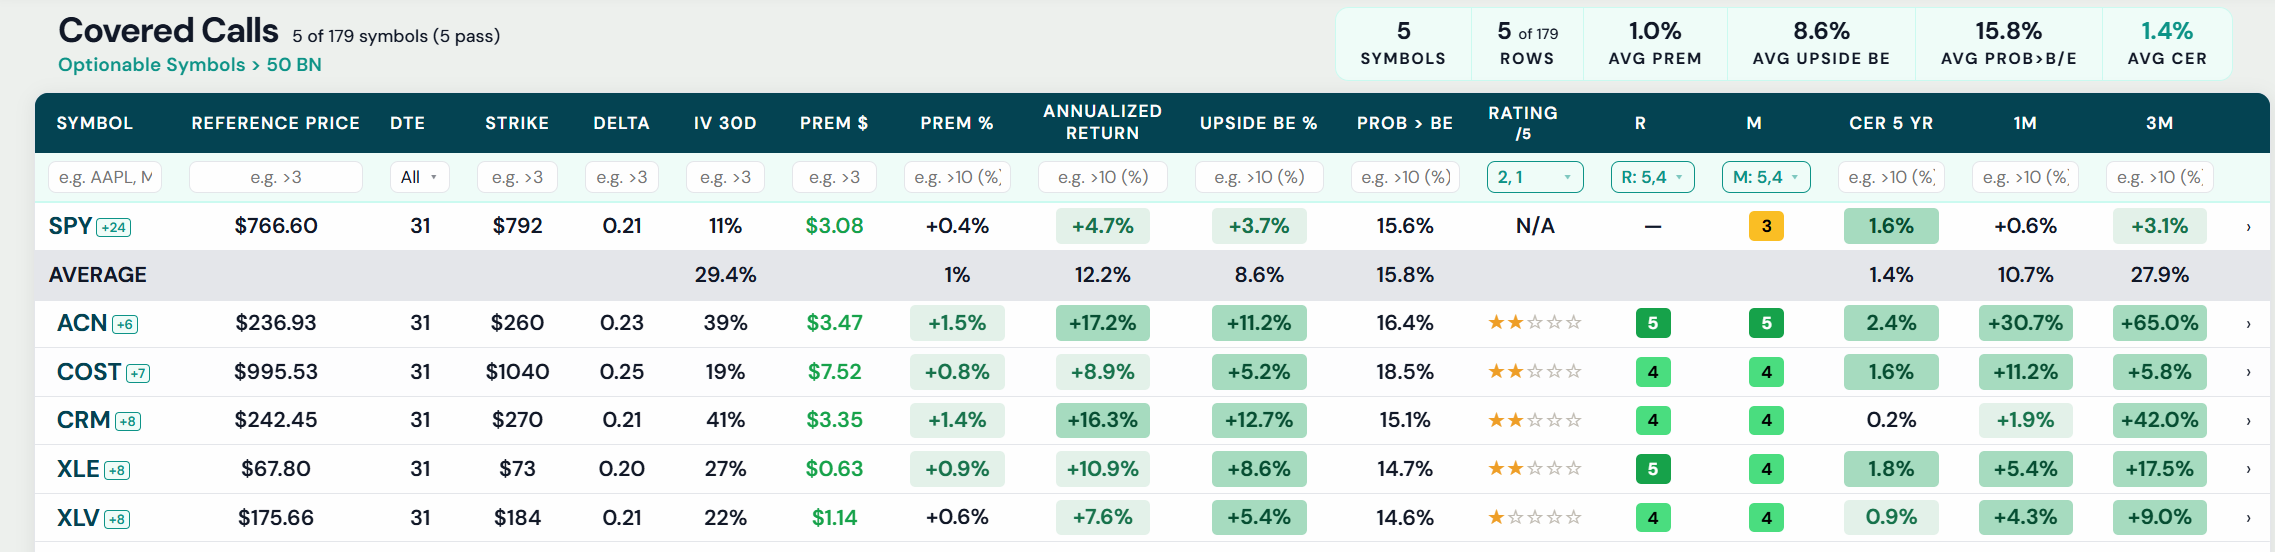
Every Volworks screen starts from the same place and narrows the same way. Here is the run from October 19, for calls expiring November 20, 31 calendar days out:
The earnings gate alone removed 124 stocks. That is not unusual in late October; writing a call through a scheduled report caps the gap you cannot keep while leaving you all of the gap down, so we do not rate those names at all. The last step is the one this article is about: of the 24 names our model rates poorly, five got there not because the stock looks weak, but because it looks too strong to cap.
What we look at that the premium does not show
Our star rating is a composite, and it is relative: a 5 is the best trade-off between income and capped upside in the screened universe on that date, and a 1 is the worst. Four of the inputs matter most for this article, and we publish them beside every rating.
Seasonality, measured by CER™. Contextual Expiration Return is what the stock has historically done between today’s date and this specific expiration, counted in calendar days, over the past five years, weighted toward recent years. A name with a strong history into this window is a poor candidate to cap. It is a description of history, not a forecast.
Momentum. A proprietary measure of the direction and persistence of the recent trend, scored 1 to 5. It is related to relative strength but looks over a longer window, roughly 30 to 40 days, so it is slower to flag and harder to fool.
Relative performance. How the stock has done against SPY and against its own sector ETF over one and three months, scored 1 to 5. A stock can be up and still be lagging; this separates the two.
Trailing returns. The plain one- and three-month returns. For context on October 19, SPY was up 0.6% over one month and 3.1% over three.
Each of these measures something different, and the point of this piece is that no single one tells the whole story. A stock can have unremarkable seasonality and still be a bad call to write, because the other three say it is in the middle of a move.
Accenture: the trade that looks best and rates only 2 stars
On October 19, Accenture closed at $236.93. The November 20 $260 call, at 0.23 delta, traded $3.47, or 1.5% for 31 days, about 17% annualized. The breakeven cap is $263.47, 11.2% above the current stock price, and the implied probability of finishing above it is 16.4%. Judged on premium, room to run and the odds of being called away, this looks like the best trade on the screen.
Now the rest of the row. Momentum: 5 out of 5. Relative performance: 5 out of 5. One-month return: +30.7%, compared with +0.6% for SPY. Three-month return: +65.0%, compared with +3.1%. Since its low on June 29 the stock is up $112.19, or 89.9%, in 78 trading days, and it would need to climb another 22.9% to reach its 52-week high of $291.09. Seasonality, for what it is worth here, is modestly positive: a five-year CER of 2.4% into this window. Rating: 2 out of 5.
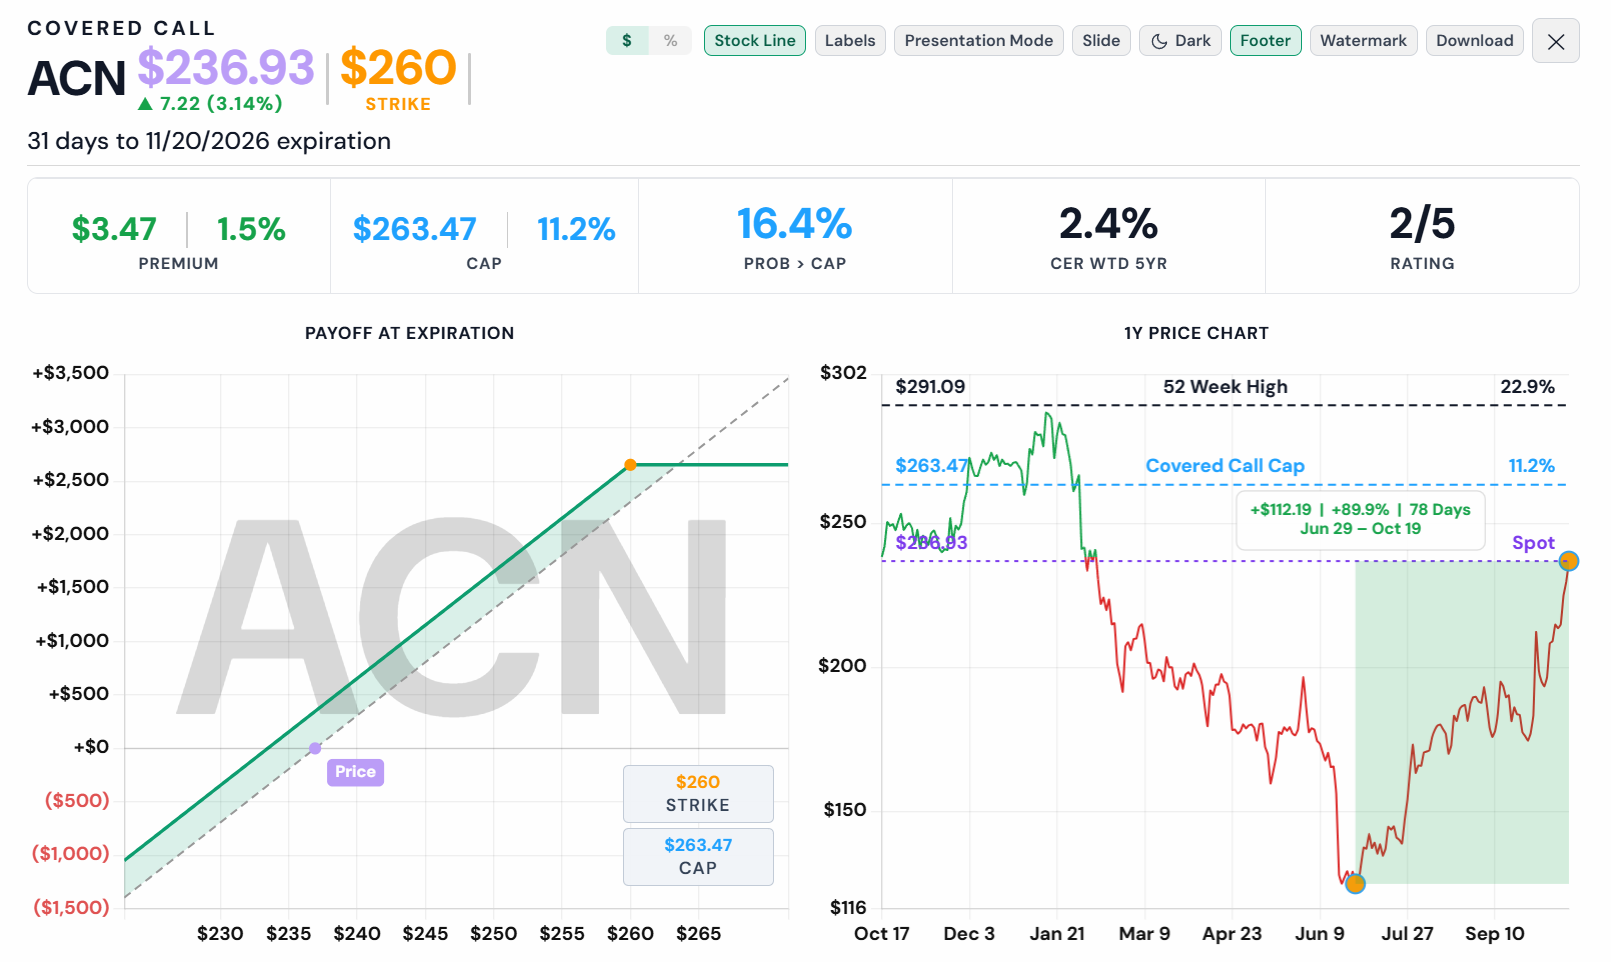
Here is the question the premium cannot answer. Is 1.5% enough to be paid for giving up everything above 11.2% on a stock that moved 30% last month and 65% last quarter? A call written a month ago at the same distance would have been through its cap in under two weeks. Nothing in our data says the move continues; nothing in our data says it stops either. What the data says is that this is a stock in motion, that the market is pricing 39% implied volatility into the call for exactly that reason, and that the 1.5% premium comes with a 16% risk of capping the stock and surrendering further gains.
We would not write it. If an advisor is determined to collect something on Accenture, we would suggest a smaller allocation, a higher strike, or waiting for the momentum score to come off its ceiling.
Costco, Salesforce and two sector ETFs: the same pattern at a lower price
Costco is the quieter version of the same trade. At $995.53, the November 20 $1,040 call (0.25 delta) traded $7.52, or 0.8%, with a 5.2% cap and an 18.5% probability of finishing above the cap. Implied volatility is only 19%, so the premium is modest and the cap is close. But momentum and relative performance are both 4, the stock is up 11.2% in a month against SPY’s 0.6%, and its five-year CER into this window is 1.6%. A 5.2% cap on a stock that just moved 11% is a thin margin for 0.8%. Rating: 2 stars.
Salesforce shows how the inputs can disagree and still land in the same place. The $270 call generates 1.4% with a 12.7% cap, and the one-month return is a modest 1.9%. But the three-month return is 42.0%, momentum and relative performance are both 4, and seasonality is essentially flat at 0.2%. Two stars.
The two ETFs make the same point without single-stock noise. XLE (energy) generates 0.9% with an 8.6% cap; relative performance is 5, momentum 4, and the sector is up 17.5% in three months. XLV (health care) generates 0.6% with a 5.4% cap and is the only one-star name in the group: up 9.0% in three months, scores of 4 and 4, and the least premium of the five to show for capping it.
| Name | Premium | Cap (upside BE) | 1M / 3M return | Momentum / Rel. perf. | CER 5yr | Rating |
|---|---|---|---|---|---|---|
| ACN | 1.5% | 11.2% | +30.7% / +65.0% | 5 / 5 | 2.4% | 2 |
| COST | 0.8% | 5.2% | +11.2% / +5.8% | 4 / 4 | 1.6% | 2 |
| CRM | 1.4% | 12.7% | +1.9% / +42.0% | 4 / 4 | 0.2% | 2 |
| XLE | 0.9% | 8.6% | +5.4% / +17.5% | 4 / 5 | 1.8% | 2 |
| XLV | 0.6% | 5.4% | +4.3% / +9.0% | 4 / 4 | 0.9% | 1 |
| SPY (reference) | 0.4% | 3.7% | +0.6% / +3.1% | — | 1.6% | — |
Calls expiring November 20, 2026, at approximately 20–25 delta. Data as of October 19, 2026.
Read down the premium column and nothing stands out; these are ordinary numbers. Read across the row and every one of them is a stock or sector that has been outrunning the market, with a cap set inside the distance it just covered.
No metric in isolation
It would be easy to read this as “never write calls on strong stocks.” That is not the lesson. Strong stocks with a weak history into a given window, or with momentum that is rolling over, can be fine candidates, and the same Accenture may screen very differently in January. The lesson is narrower and more useful: no single number decides a covered call. Not premium, not the cap, not seasonality, not momentum. Seasonality is a powerful indicator on its own, and it still gets overruled here by three other inputs that all point the same way.
That is why the rating exists. It is the platform doing the calculations so you do not have to hold six columns in your head for every name in every account. And it is why the rating is relative rather than absolute: it tells you where a trade stands against everything else available that day, which is the decision you are actually making.
Disclosures: Educational content only; not investment advice or a recommendation to buy or sell any security or option. Volworks LLC is not a registered investment adviser or broker-dealer. Options involve significant risk and are not suitable for all investors; please read the OCC’s Characteristics and Risks of Standardized Options. Platform figures are illustrative output as of October 19, 2026, gross of commissions, fees and taxes. Star ratings, CER™, probabilities and momentum and relative-performance scores are relative, historical measures within the screened universe on that date, not forecasts. A low rating is not a recommendation to sell, avoid or short any security.
About the author: Victor Viner is Founder & CEO of Volworks. He co-founded Volaris Advisors and founded V2 Capital, both SEC-registered investment advisers, where he served as President and Chief Investment Officer. Volaris ran discretionary covered call programs for family office and institutional clients and was acquired by Credit Suisse; V2 Capital managed a hedge fund, a liquid alternatives mutual fund, and separately managed accounts. He has over 25 years of institutional derivatives experience.