Costco fell 3.91% following its earnings release this week — exceeding the 3.4% implied move priced by the options market, and the largest single-day Q2 earnings reaction in the past decade of data.
At Volworks, we track post-earnings drift across 800+ names — not the earnings-day reaction, but what the stock does 7, 14, and 28 days after. For advisors managing existing positions, that forward window is often where the more actionable data lives.
Here is what the Costco history shows.
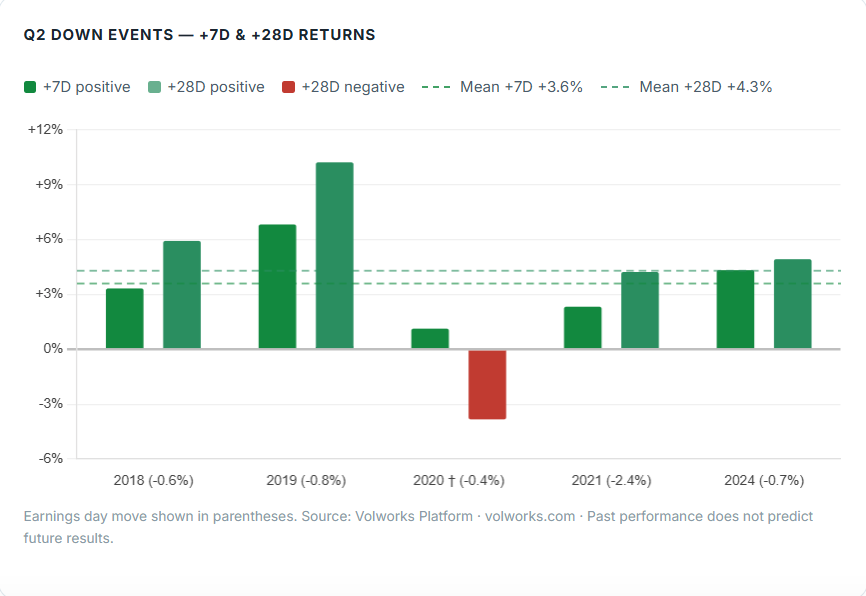
Q2 Down Events — +7D & +28D Returns
Earnings day move shown in parentheses. Source: Volworks Platform · volworks.com · Past performance does not predict future results.
The All-Cycle Picture
Across all 40 COST earnings events over the past decade, the 23 instances where the stock declined on earnings day produced a moderately positive post-earnings drift — consistent with the broad large-cap pattern, though the aggregate can obscure meaningful quarter-specific behavior.
The Q2 Cycle: A More Defined Pattern
Isolating Q2 earnings — the current cycle — and filtering to the 5 prior instances where COST declined on earnings day produces a notably cleaner result.
Every prior Q2 down event was followed by a positive return at +7 days — 5 for 5. The +28 day window is 4 of 5, with the May 2020 exception attributable to COVID-era market dislocation.
COST — Post-Earnings Performance, Q2 Down Events
| Date | Earnings day | +7 days | +28 days |
|---|---|---|---|
| May 2021 | −2.4% | +2.4% | +4.3% |
| May 2019 | −0.8% | +6.9% | +10.3% |
| May 2024 | −0.7% | +4.4% | +5.0% |
| May 2018 | −0.6% | +3.4% | +6.0% |
| May 2020 † | −0.4% | +1.2% | −3.9% |
| Source: Volworks Platform, 40 COST earnings events over 10 years. † May 2020 occurred during COVID-era market dislocation. | |||
Implications for Advisors
For advisors holding long COST positions, the historical drift data supports a considered approach to options overlays in the weeks ahead. The consistency of the +7D recovery across all prior Q2 down events — and the 77–80% positive rate at +28 days across both sample sets — provides a meaningful input for decisions around covered calls, boosters, or position management.