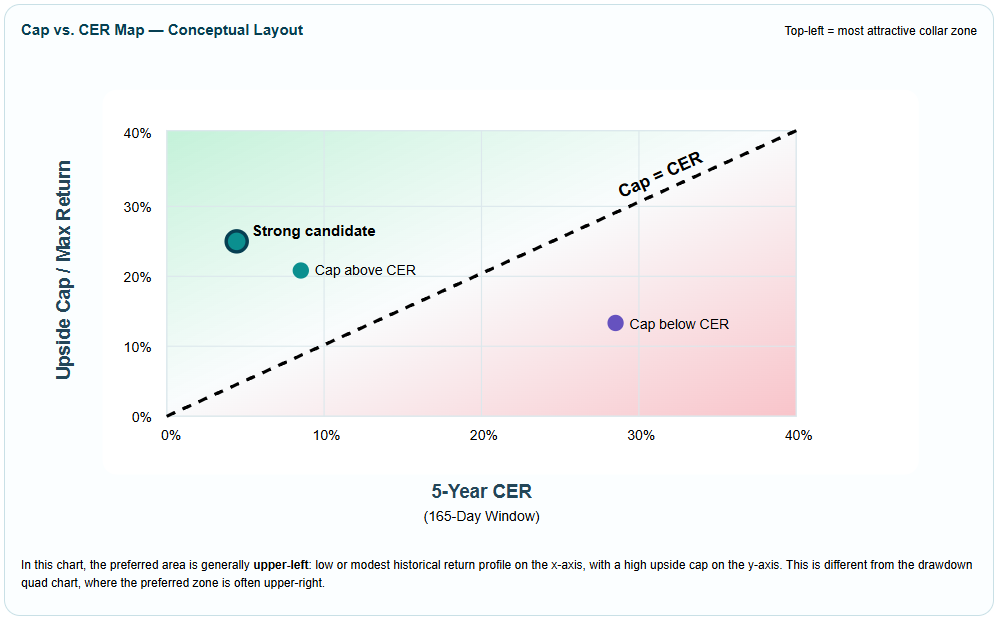
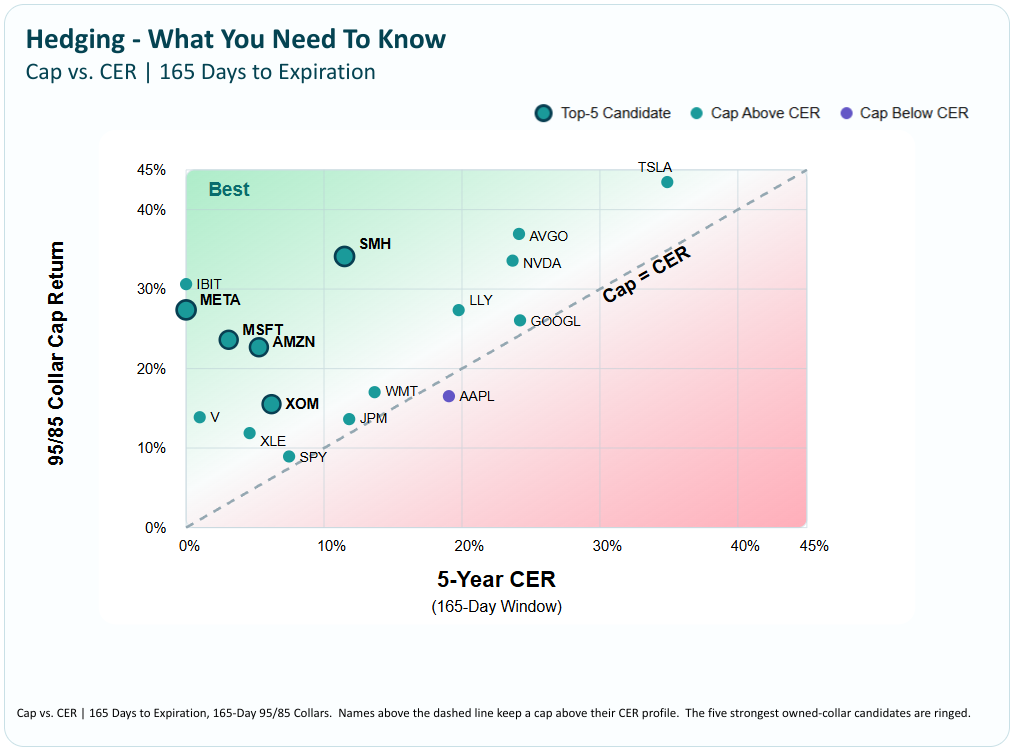
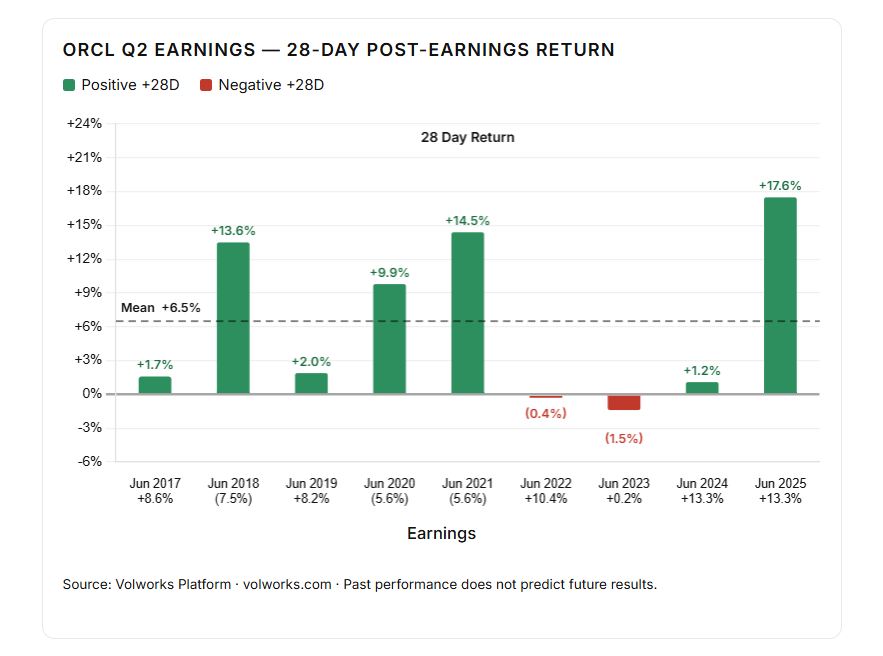
- Markets at all-time highs. Embedded gains in concentrated positions. Real macro and geopolitical risk. You and your clients should at least be considering a hedge.
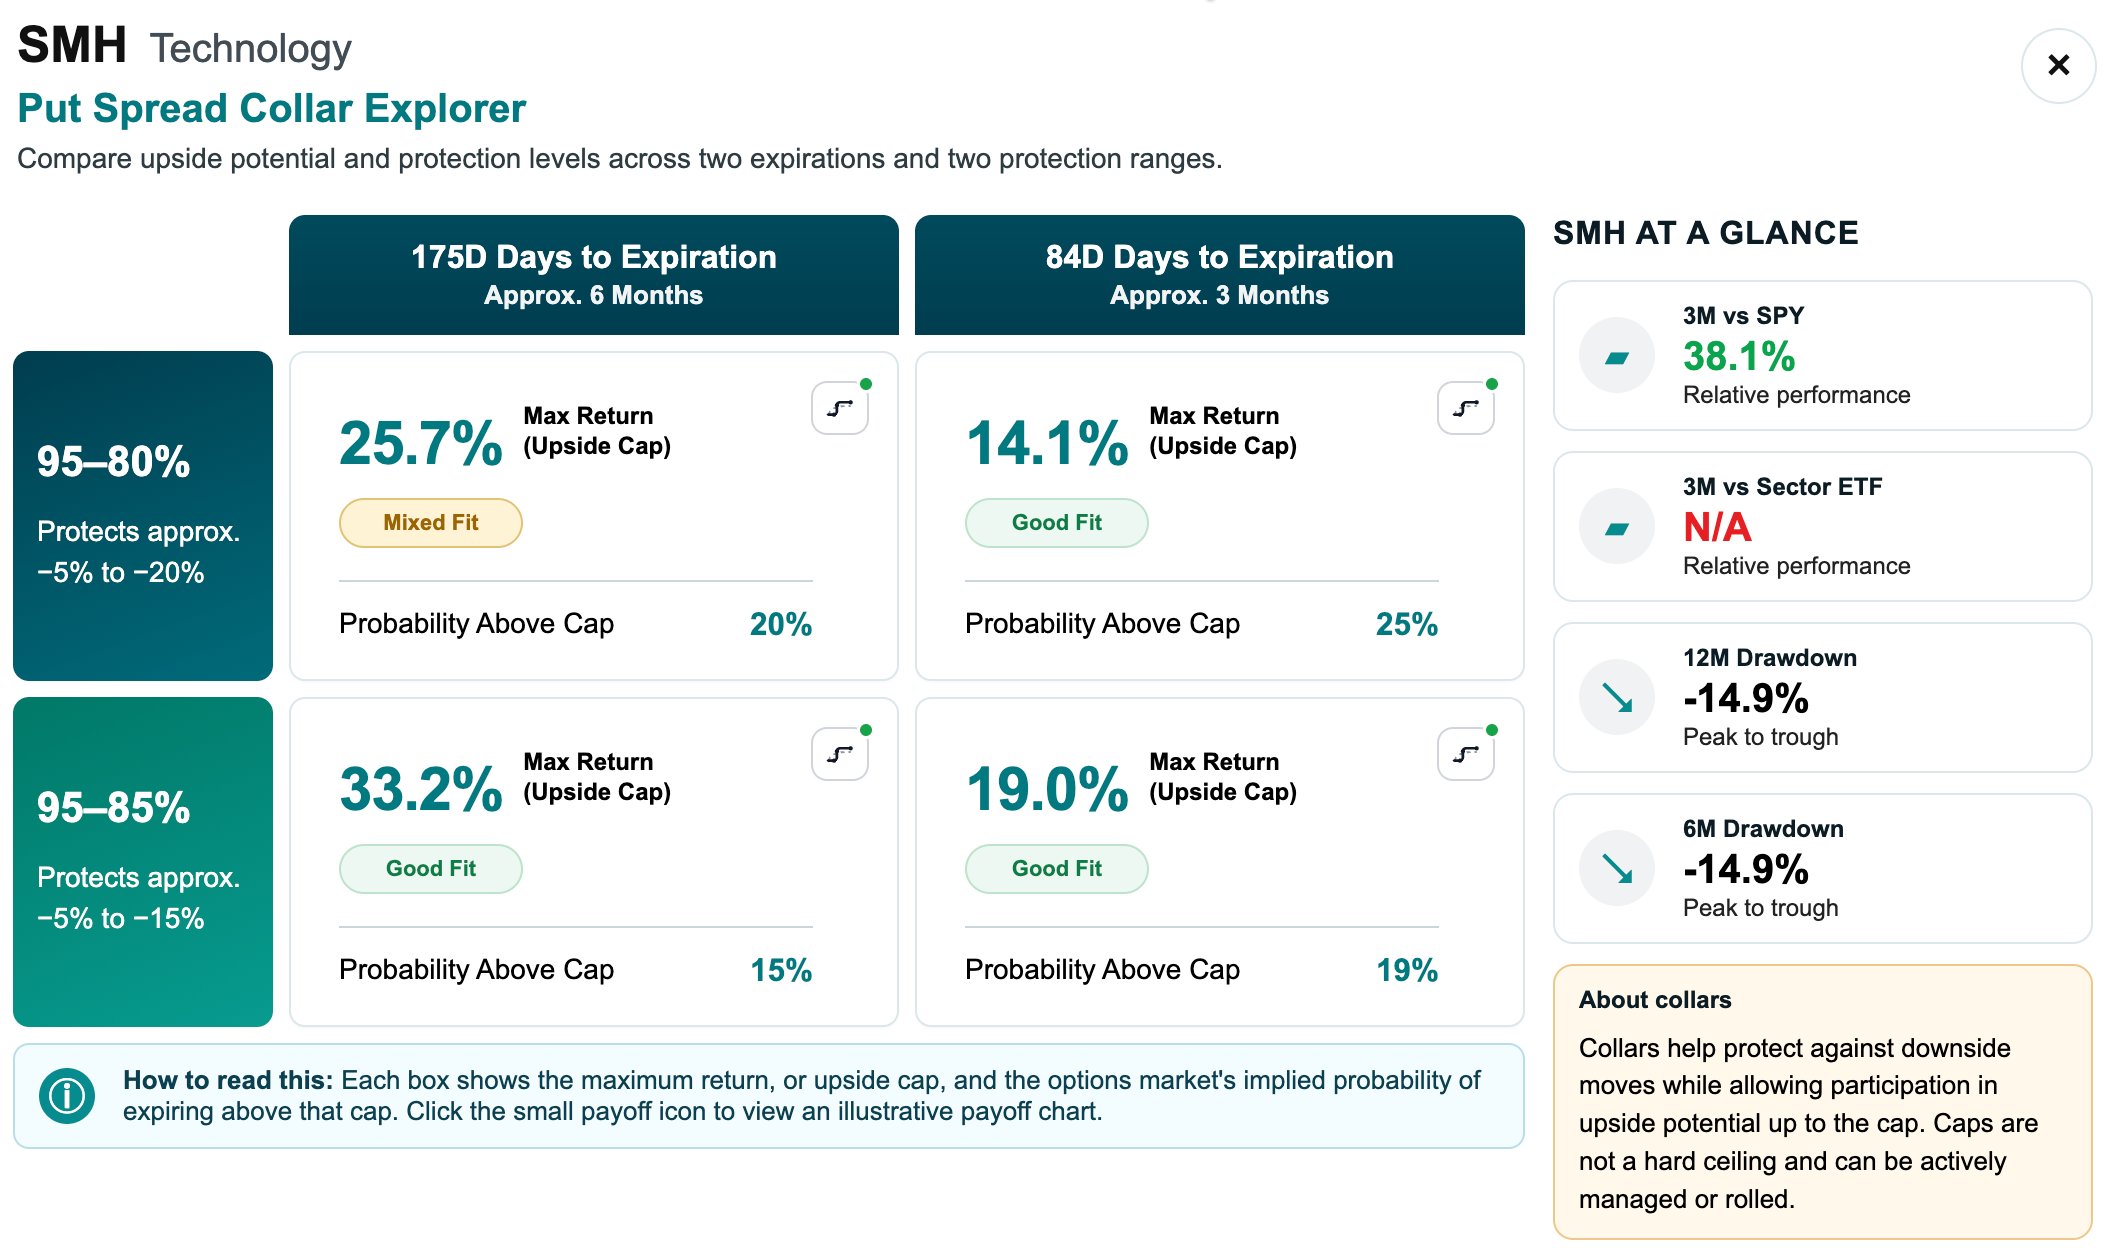
- Three numbers carry the conversation: the Cap, the Protected Corridor, the 12-month Drawdown.
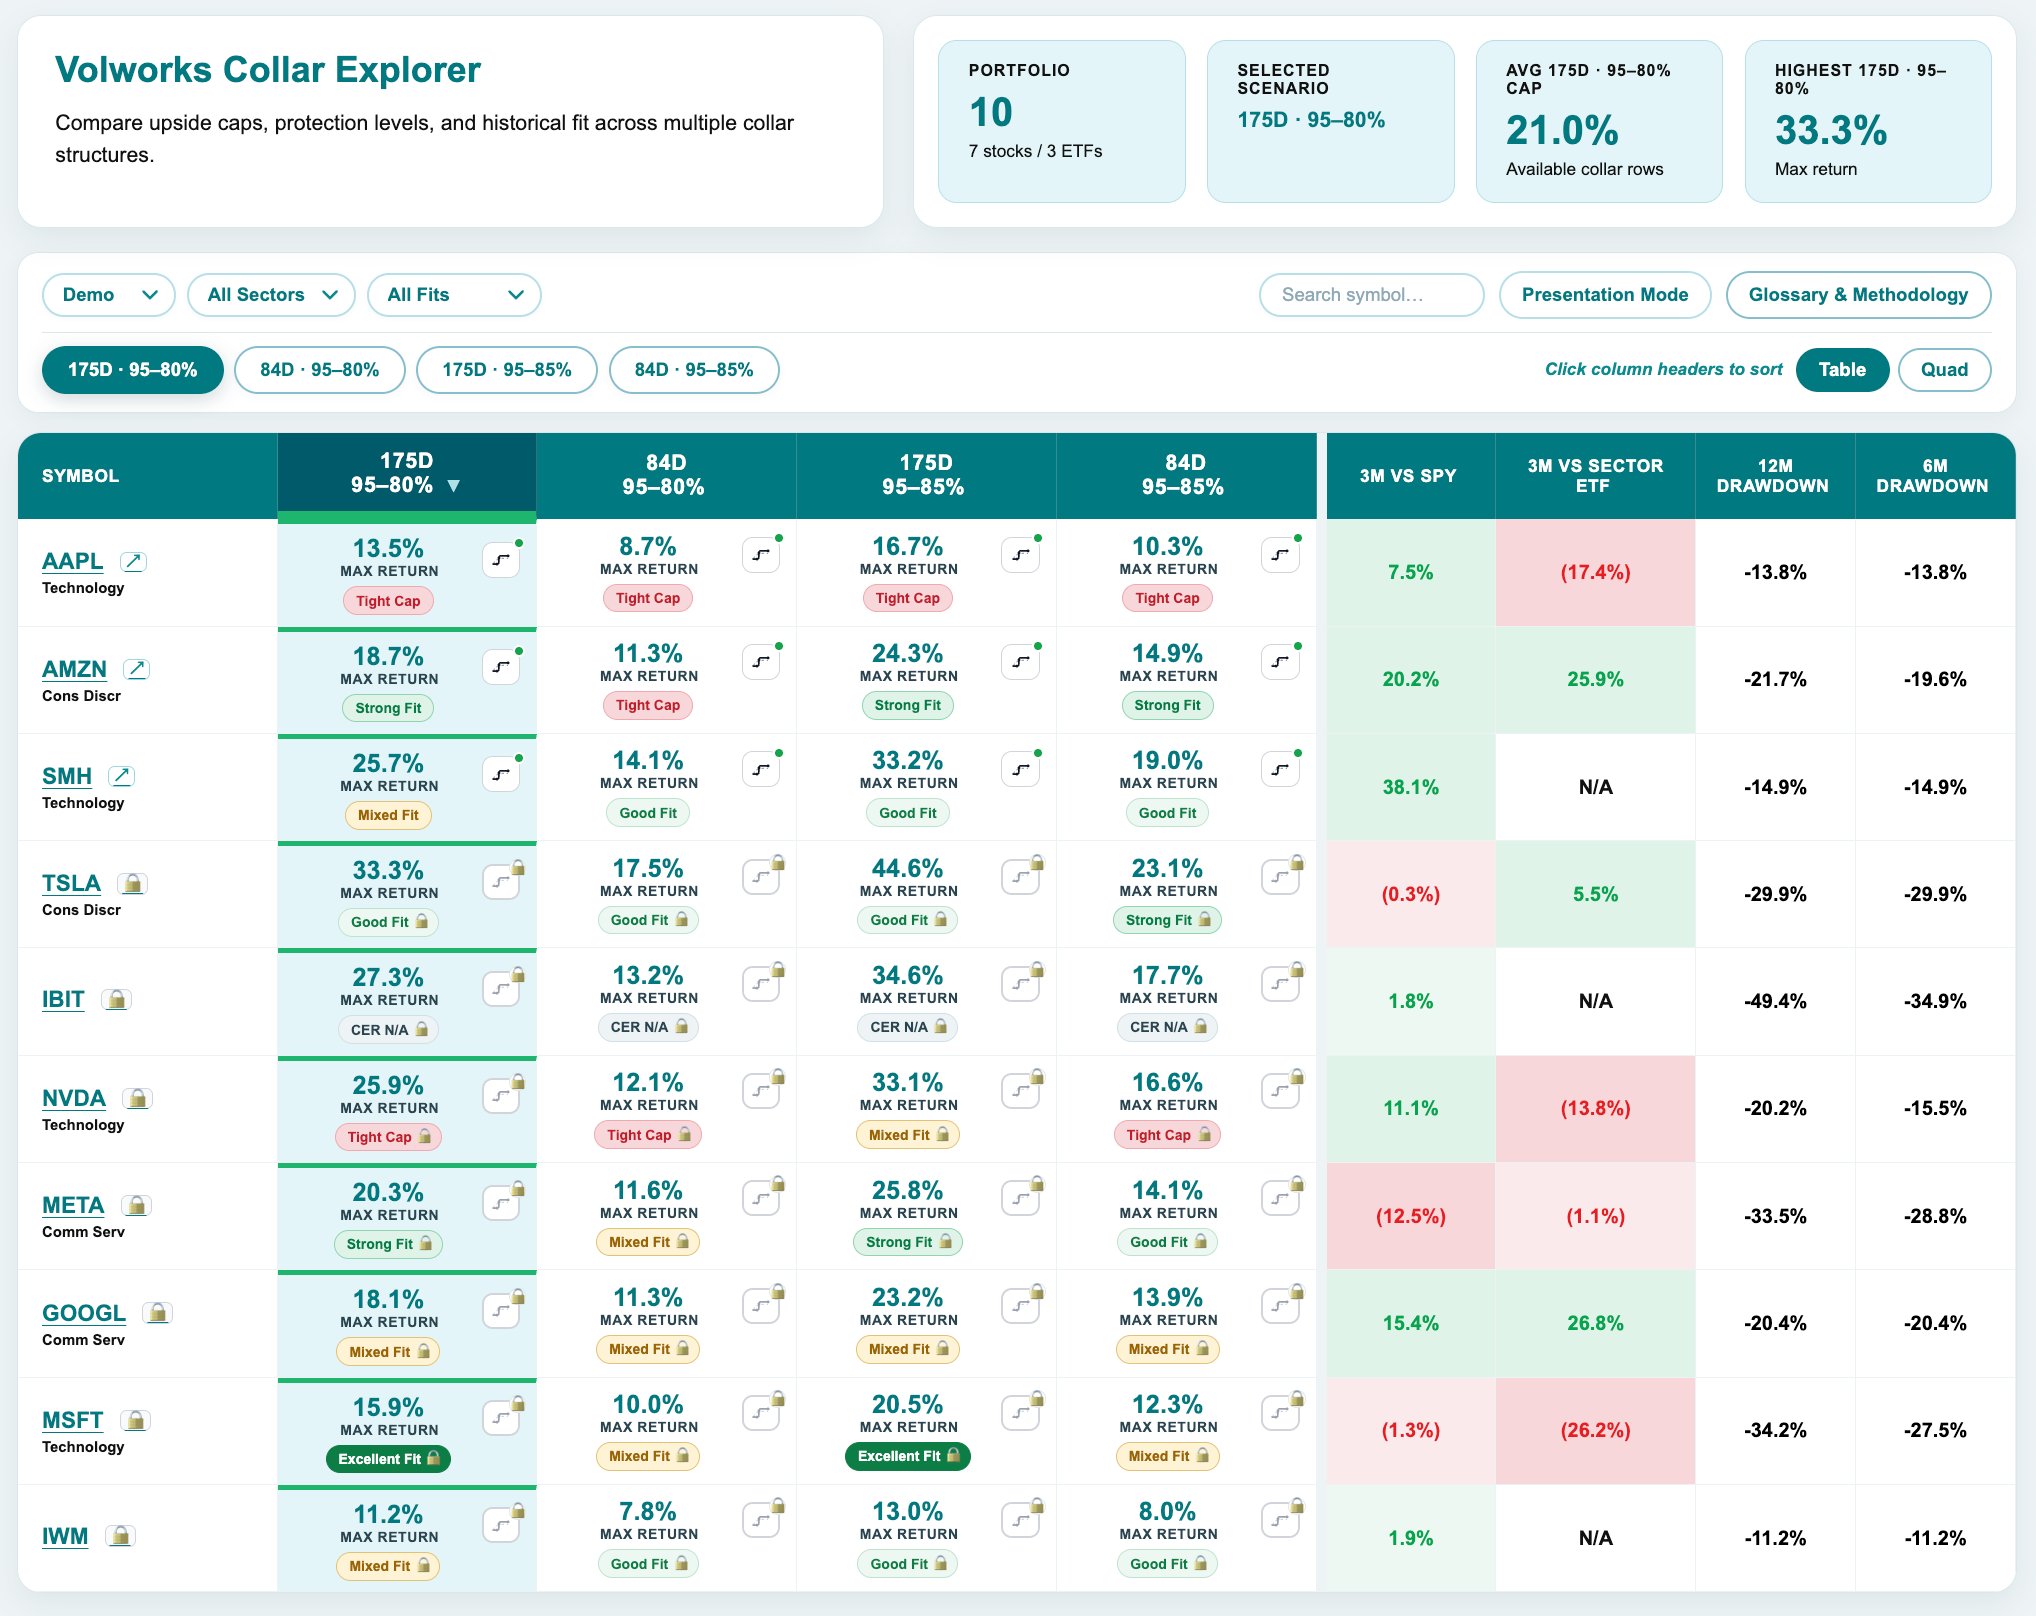
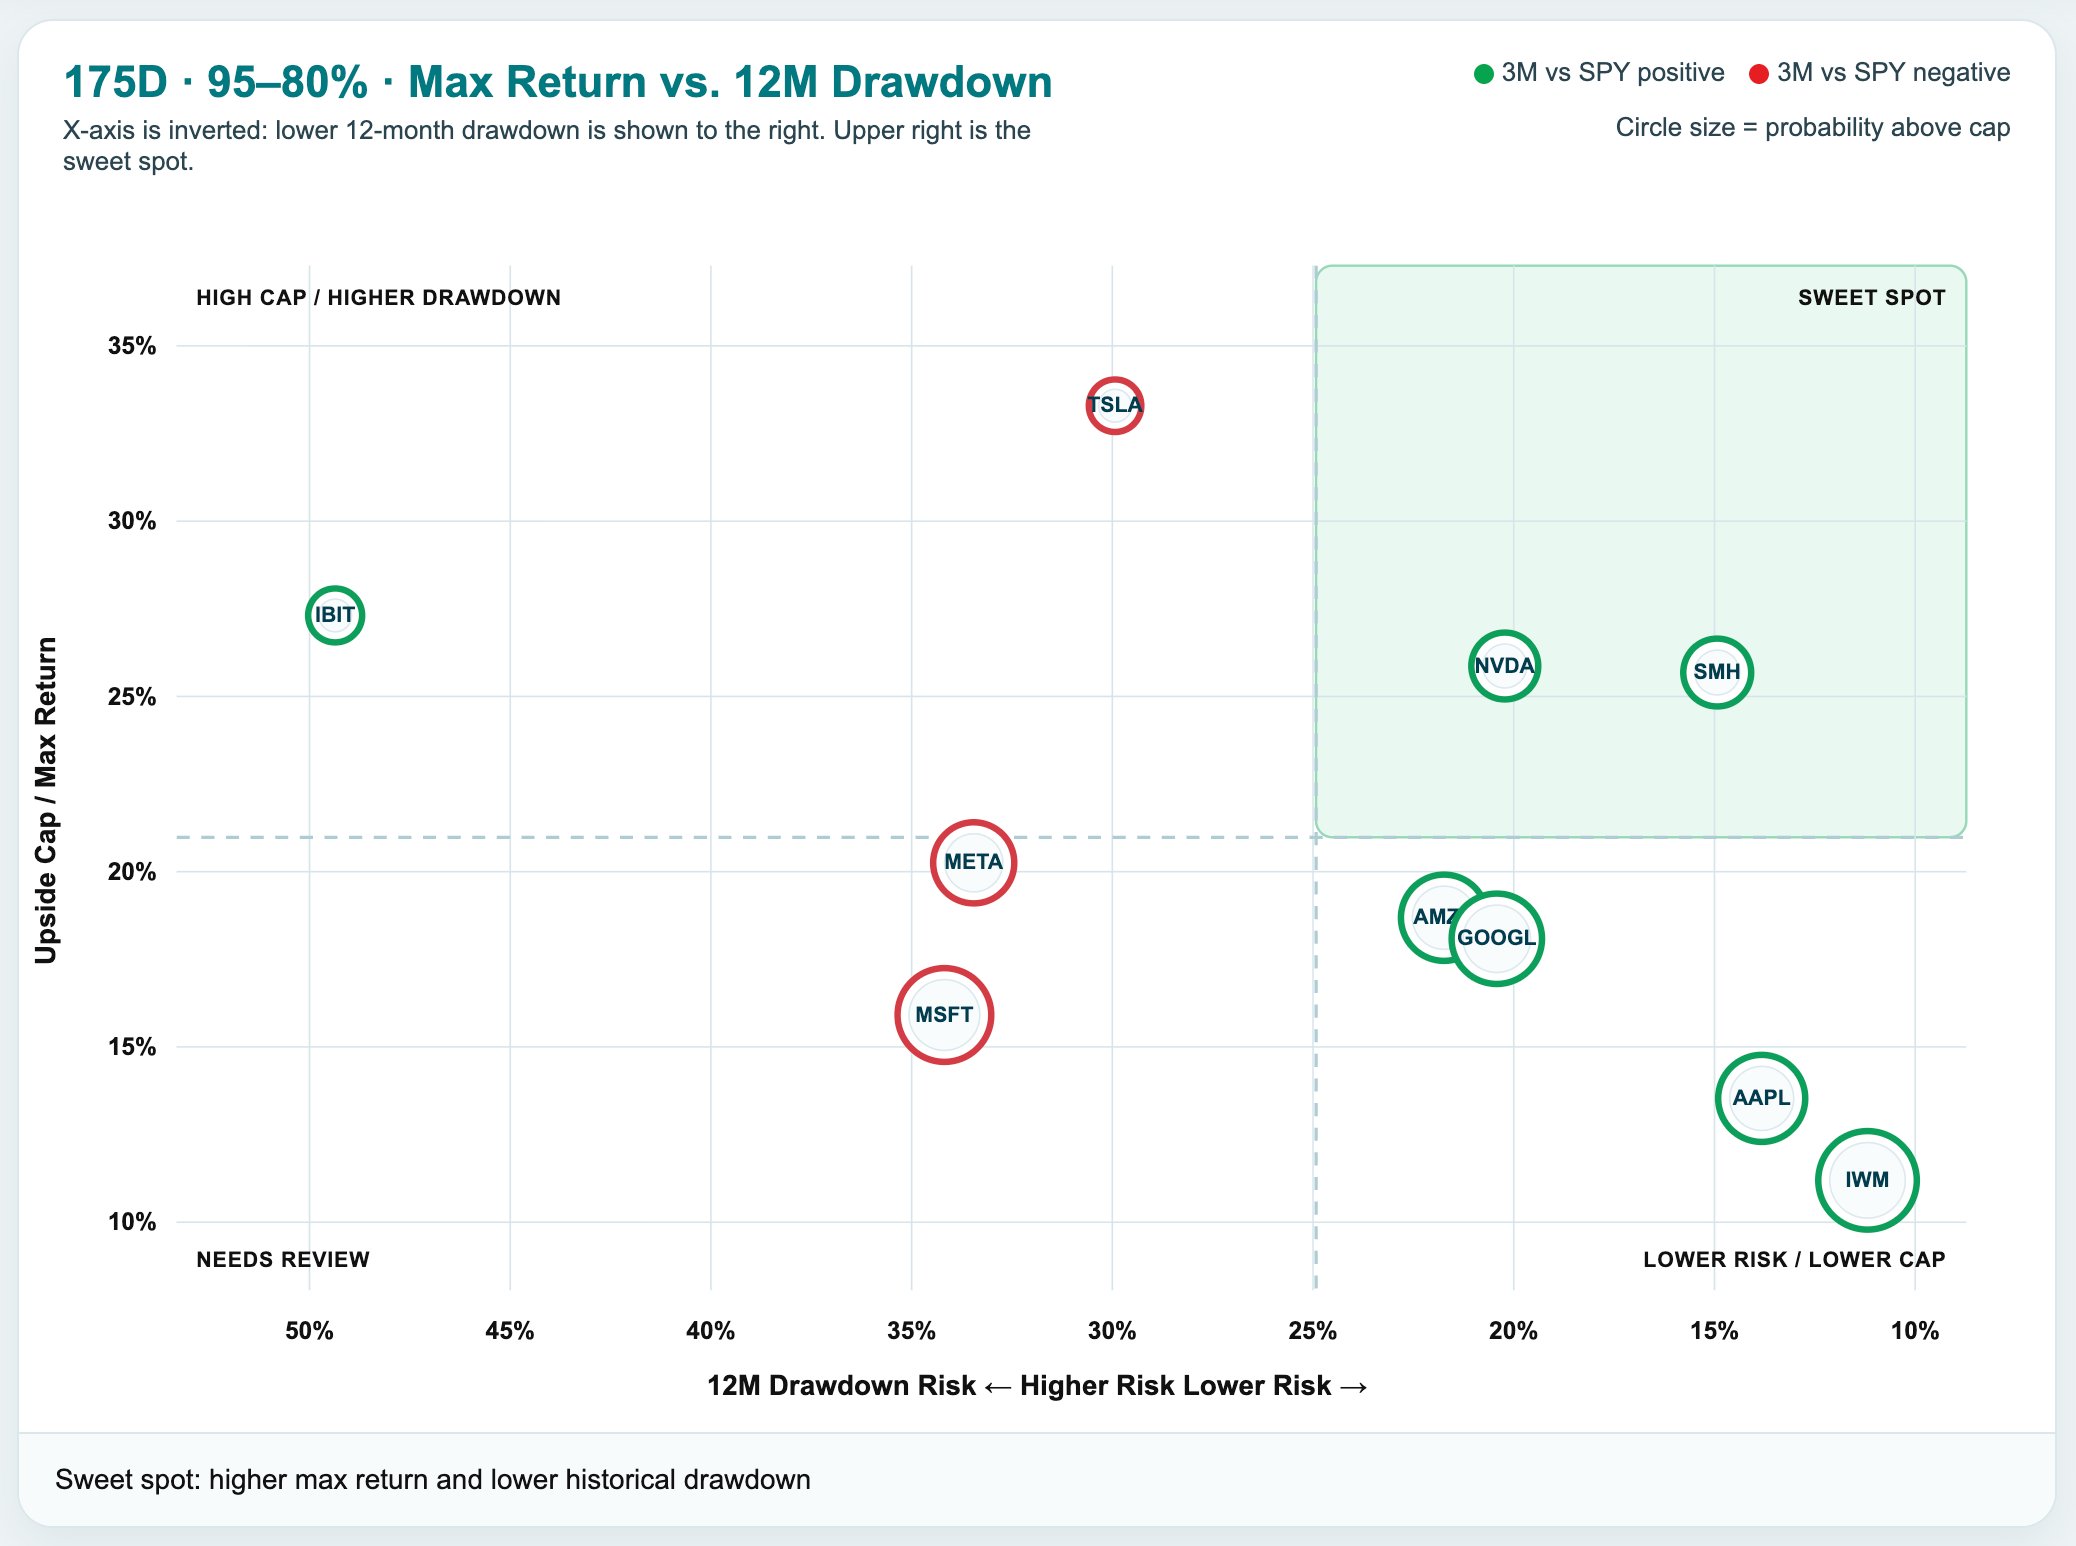
- On a six-month 95/80 put spread collar across the MAG 7, the average cap is +21%. The narrower 95/85 version averages +27%.
- The line every hedging article leaves out: a listed collar is not a structured product. The cap can be actively managed.
Over the years, I’ve written countless articles and presentations on hedging, typically ranging from 1,000 to 3,000 words. The longest stretched to ten pages, complete with exhibits, Greeks, probability surfaces, and the full institutional toolkit. They were technically strong, but the feedback from advisors was always the same: “This is great, but I still don’t really understand it.”
What I have also seen is the inverse. Once advisors and clients understand the pros, cons, and trade-offs of a well-designed put spread collar, they consider it seriously for many of their positions. The barrier is comprehension. Not trade.
The audience that actually needs this trade — advisors and the clients they sit across the table from — does not want to read ten pages of research with exhibits they do not follow.
So here’s the short version: the three numbers that matter, the trade in one paragraph, what the caps look like across names you actually own, and the one fact about the structure that most articles — including, until recently, mine — leave out.
Everything here points back to a single tool.
Live caps for ten of the most widely-held names in client books today — the MAG 7 plus IBIT, SMH, and IWM — with every cap, every probability, multiple protection corridors, all four structures side by side. Click any name to drill into the full matrix and at-a-glance stats.
1. The three numbers that matter
Most articles on collars open with a data wall — Greeks, term structure, put-call skews, exponentially-weighted downside beta, IV percentiles, the whole apparatus. We use all of it internally to pick a candidate and pick a structure. None of it belongs in front of a client. What belongs in front of a client is three numbers.
If your protection runs to −20% and the stock just fell −35%, you have a conversation about widening the corridor or picking a different structure. If your protection runs to −20% and the stock fell −15%, you have answered the conversation. That is the entire decision the client needs to make.
2. Why this conversation, why now
Because you and your clients are worried. And you should be. Markets at all-time highs after a decade of unprecedented risk-on. Geopolitical knots without obvious resolutions. Concentrated winners holding embedded gains that nobody wants to realize at current tax cost. The fact that nobody can identify the catalyst for the next drawdown does not make the drawdown less likely.
Here is what the screen actually shows:
- The S&P 500 sits within a fraction of an all-time high. The VIX is around 16. By those two readings alone, the market sees a stable, well-priced environment.
- That is not what is in front of us. 10-year Treasury near or at a one-year high. CPI at the highest in years. Futures markets pricing a high probability of a Fed hike by year-end, not a cut.
- Active conflict in the Persian Gulf. Drone strikes have lifted Brent above $110, reshaping the energy and inflation pictures in real time.
- Put spread collars are the structure built for this combination of facts.
3. The trade, in one paragraph: 95–80% Zero-Cost Put Spread Collar
Take a stock at $100. Buy a six-month $95 put to start protection, then sell an $80 put, where that protection ends — you absorb any loss beyond 20%. Next, sell an out-of-the-money call with the same expiration that generates enough premium to finance the put spread. Across the MAG 7, in a six-month version of this trade, that call is typically set about 14% out of the money for AAPL and as much as 33% out of the money for TSLA, with an average near 21%. The stock position stays in place, and the trade defines the risk on both the downside and the upside.
4. What the caps actually look like
The cap depends on two choices: how long you want the trade on, and how wide a protection band you want inside it. Two by two. The MAG 7 averages, with the range across the seven names underneath:
5. The missing point
Most articles on hedging — put spread collars, variance swaps, structured notes, any of the sophisticated alternatives — describe these positions as if they were finished products. Buy here, hold to expiration, here is what you get. That framing fits an OTC structured product that genuinely cannot be touched once it is on the books. It does not fit a listed put spread collar, which is alive every day of its life. The line that matters most is the one nobody writes.
A put spread collar built with listed options — or with flex options — is alive throughout its life. If the underlying rallies into the short call before expiration, the call can be bought back and a higher strike one can be sold at zero cost; same logic as rolling a covered call up and out. If implied vol moves materially, the put spread can be rebalanced into a different protection band. If the macro thesis changes, the whole structure can be unwound. Most articles describe a position you put on and watch happen to you. That is not the right model. The right model is a position you start with and then actively shape throughout its life, as warranted by the market. While it can be “set it and forget it,” it doesn’t have to be.
Top professionals know this. However, it is rarely if ever in print. Which is where the average advisor or investor runs into the wall — knowing the cap can be managed is one thing; knowing when to manage it, how to manage it, and at what strikes is another. That is the platform we have built. The Volworks Platform tracks every active collar throughout its life, surfaces rebalance signals as they appear, and gives advisors the same active-management intelligence that institutional desks have had for decades.
A client doesn’t need or want a primer on the Greeks. They don’t need to be an options expert to benefit, either.
They need three numbers — Cap, Protection, Drawdown — a platform they can scan for their own positions, and the knowledge that the cap they see today is movable. The platform handles everything else. That is the whole conversation. It takes about a minute, and they read every word of it.
About the data: Cap averages and ranges drawn from the Volworks Collars Explorer, May 28, 2026 snap. Universe for the averages: the MAG 7 (AAPL, AMZN, GOOGL, META, MSFT, NVDA, TSLA). The Explorer App covers ten names — the MAG 7 plus IBIT, SMH, and IWM (more added all the time). Strategy: 95/80 and 95/85 put spread collars at ~180-day and ~90-day expirations. Macro readings (VIX, 10Y Treasury, CPI, Brent crude, Fed funds futures) as of mid-May 2026.
Disclosures: This article is for educational purposes only and does not constitute investment advice or a recommendation to buy or sell any specific security. Options involve risk and are not suitable for all investors. Past performance is not indicative of future results. Probability estimates are model outputs based on implied volatility and are not guarantees. Cap management depends on prevailing market conditions; the ability to roll, rebalance, or unwind is not guaranteed at any specific price.
© 2026 Volworks