Volworks Hedging Research
You Don’t Have to Sell to Reduce Risk
Five attractive collar candidates from the Volworks Core 21 Portfolio for investors who are cautious over the next three to six months but do not want to exit positions they intend to keep.
The Question Investors Keep Asking
Since our earlier piece on the Volworks Collars Explorer, the follow-up questions have been less about options mechanics and more about portfolio decisions.
That is the real investor problem.
- They do not want to sell long-term holdings.
- They do not want to trigger taxes unnecessarily.
- They do not want to sit in cash and miss a rebound.
- They do want meaningful protection if the market gets worse.
- But they may not want a one-size-fits-all, index-based buffer ETF. Many investors are not trying to hedge “the market” in the abstract. They want to evaluate protection stock by stock, for the positions they already own, with the flexibility to actively monitor and manage the collar as conditions change.
The goal is to stay invested while improving the trade-off between downside protection and upside participation.
Why We Used the Volworks Core 21 Portfolio
For this article, we focused on the Volworks Core 21 Portfolio because it contains many of the most widely held stocks and ETFs and generally offers the option liquidity needed for efficient collar construction.
The Volworks Core 21 Portfolio is a small sampling of over 1,000 stocks and ETFs that Volworks covers.
In other words, the names shown here are representative examples, not the only opportunities we evaluate.
The Key Question: How Much Upside Am I Really Giving Up?
Most investors focus first on what they may be giving up. That is exactly the right place to start.
Upside Cap
The initial maximum return of the collar at expiration.
CER™
Volworks’ five-year, recency-weighted average return for a comparable holding period.
Cap Efficiency Ratio™
When CER is positive, Cap Efficiency = Cap ÷ CER.
Cap Spread
A universal companion metric: Cap Spread = Cap − CER. This works even when CER is zero or negative.
When CER is positive, we show the numeric Cap Efficiency Ratio. When CER is zero or negative, the ratio is not meaningful, so we rely on a straightforward Cap Spread.
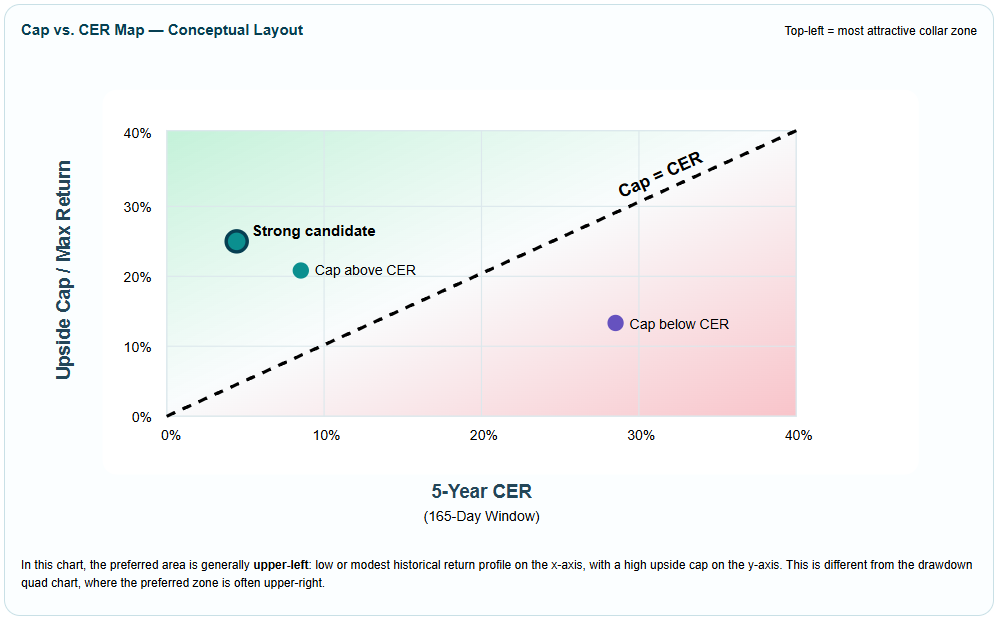
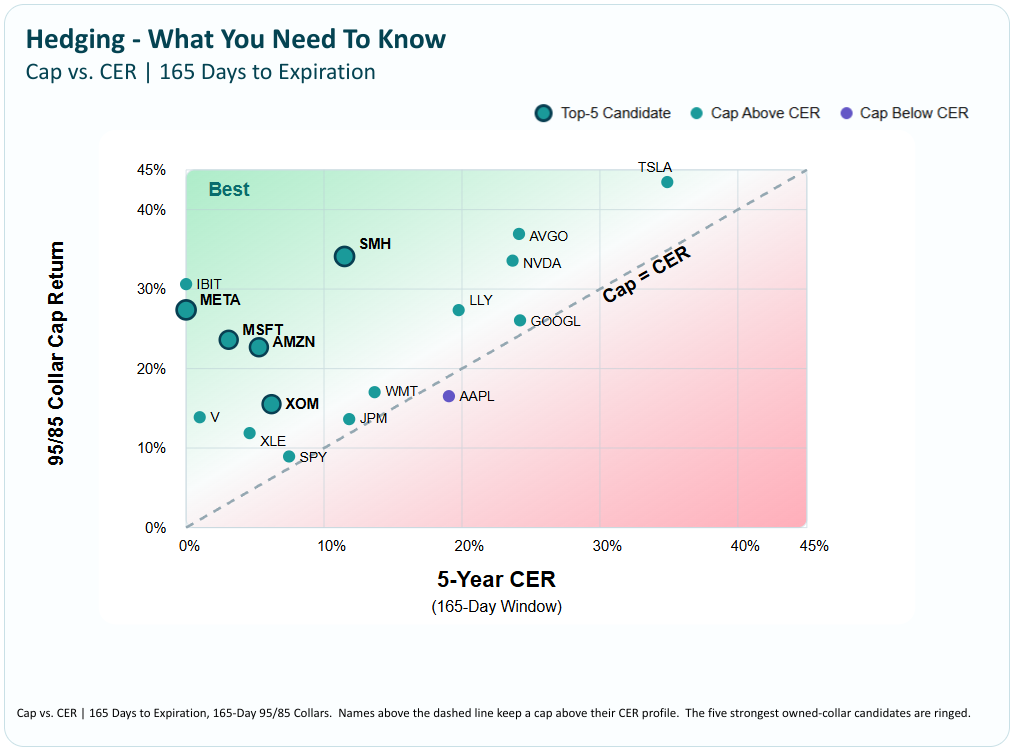
The Map: Cap vs. CER
This is the most important visual in the article. The diagonal line shows where the upside cap equals the historical return profile. Names above the line retain a cap above historical return. Names below the line may be more expensive to collar because the cap cuts into returns history says were more likely.
Hedging - What You Need To Know
Cap vs. CER | 165 Days to ExpirationFive Attractive Hedging Candidates
For the article, we used approximately six-month 95/85 put spread collars as the default comparison because they show the trade-off between retained upside and protection clearly. That is a normalized analytical choice, not a universal recommendation. More defensive investors, or investors with a stronger bearish view, may prefer the 95/80 version in practice.
| Symbol | Structure (% of Spot) |
Upside Cap | 5Y CER | Cap Spread | Cap Efficiency / Context | Why It Stands Out |
|---|---|---|---|---|---|---|
| MSFT | 95/85 | 24% | 3% | 21% | 7.65x | Widely held, currently under pressure, and historically modest over this same window. A very efficient collar example. |
| META | 95/80* | 20% | (1%) | 21% | N/M • CER ≤ 0 | *Negative CER, large 12M drawdown, and large downside beta warrant using a 95/80 structure. |
| AMZN | 95/85 | 23% | 5% | 17% | 4.30x | Attractive balance of cap, historical return profile, and manageable downside characteristics. |
| SMH | 95/85 | 34% | 11% | 23% | 2.97x | A strong way to express semiconductor exposure: substantial upside retained even in a volatile ETF. |
| XOM | 95/85 | 16% | 6% | 9% | 2.51x | Attractive cap versus history, with macro and geopolitical relevance in the current market environment. |
What The Metrics Are Telling Us
1. Microsoft remains a textbook “owned-stock collar” candidate.
Historically, Microsoft’s same-window return profile has been modest, yet the collar still retains more than 23% upside. That is exactly the setup where a collar can feel less like a sacrifice and more like disciplined risk management.
2. Negative CER does not mean “ignore the stock.”
It means the ratio needs to be handled differently. For a stock such as Meta, a negative CER actually strengthens the core collar argument because the cap is not meaningfully cutting into expected upside. In those cases, Cap Spread and qualitative context become more informative than a numeric ratio.
3. Not every widely held stock is an attractive collar candidate right now.
That is an important part of the framework. In this dataset, a name such as AAPL sits below the Cap = CER line for the same structure, which suggests the cap may be tighter relative to what history says it was more likely to earn. That does not make them unhedgeable. It simply makes the trade-off less attractive.
The Cap Is Not Necessarily Final
One of the most common misconceptions about collars is that the upside cap should be viewed as a permanent ceiling. In reality, listed-options collars can often be actively managed.
As market conditions evolve, short calls may potentially be repurchased, rolled, or repositioned depending on volatility, time remaining, price movement, liquidity, tax considerations, and investor objectives.
The cap is best understood as the initial trade-off, not necessarily the final outcome. One of the advantages of the Volworks platform is the ability to monitor collar positions and identify opportunities for active management.
Use The Numbers As A Framework, Not A Mandate
The analytics in this article tell an interesting story, but they do not override investor views. They provide a structured way to compare collars, not a rule that must be followed in every case.
you may prefer a 95/80 collar across most or all of your holdings, you may choose an even more protective structure, or you may decide to reduce or sell positions outright.
If you want to rely primarily on the numbers, the framework presented here helps identify where collars appear most attractive on a normalized basis. If you have a stronger directional view, your view should drive the structure selection.
Why We Normalized The Article Around 95/85
We used approximately six-month 95/85 collars for the main map because they create a cleaner apples-to-apples comparison of upside retained versus historical CER. For more defensive positioning, the same framework can be applied to 95/80 collars.
How To Think About 95/85 vs. 95/80
- 95/85: Better when the investor wants a balanced structure that preserves more upside participation.
- 95/80: Better when the investor is more bearish or the stock or ETF has a more severe drawdown profile and a wider protection band is desired.
- Important nuance: In practice, we would not want to compare every stock or ETF to the full Core 21 on drawdown alone. A better gate is sector-relative drawdown risk, because technology, healthcare, energy, and financials naturally behave differently.
That means the article’s numbers are the starting point. The final collar structure should reflect both the data and the investor’s view.
What About Other Stocks and ETFs?
The Core 21 Portfolio is a useful starting point because it includes many widely held, liquid names that investors ask us about regularly.
But the broader takeaway is this: the framework is repeatable. We run the same type of analysis on the larger universe of stocks and ETFs we cover that meet our liquidity thresholds.
In many cases, attractive collar opportunities are found outside the obvious names. The important point is not just identifying a high cap. It is identifying situations where the relationship between historical return, downside context, and available protection creates a compelling trade-off.
Bottom Line
For investors who are cautious over the next three to six months but do not want to sell, collars can offer a practical middle ground.
In this review of the Volworks Core 21 Portfolio, MSFT, META, AMZN, SMH, and XOM stood out as particularly attractive examples when evaluated through the lens of cap, CER, and Cap Spread.
The most attractive collar candidates are often positions where the initial upside cap, before active management, sits well above the stock’s CER for the same holding window.
Related Resource
Volworks Collar Analytics Guide
This article references several Volworks analytics — including CER, Cap Efficiency Ratio, Cap Spread, EW Downside Beta, and the Cap vs. CER Map. The Volworks Collar Analytics Guide is an evergreen reference explaining what each metric measures, how to read the charts, and how the Collar Fit Labels work.
Read the Collar Analytics Guide →Disclosures
This material is provided for informational and educational purposes only and does not constitute investment advice, a solicitation, or a recommendation to buy or sell any security or option strategy. Options involve risk and are not suitable for all investors. Past performance is not indicative of future results.
Volworks analytics are intended to support research and decision-making. Investors should evaluate any strategy in light of their objectives, risk tolerance, tax situation, liquidity needs, and overall portfolio.