A look at zero-cost put spread collars on the Cboe Mag 10 stocks and on the S&P 500’s recent leaders, for advisors, their clients, and self-directed investors.
In brief
- Investors sitting on a stock that has run up usually think they have three choices: buy puts, sell calls, or do nothing. A zero-cost put spread collar is a fourth, and it keeps far more upside than most people expect.
- On the stocks in the Cboe Mag 10, a six-month collar that protects from −5% to −20% still leaves caps of 12% (Apple) to 33% (AMD). Loosen the protection to −15% and AMD’s cap rises to 45%, Nvidia’s to 27%.
- A put spread collar insures the decline you’re actually worried about, not a fall to zero. That’s why it’s cheaper than a traditional collar and why the cap can be so generous.
- The cap is soft. Like a covered call, the short call can be rolled up and out if the stock keeps running.
- Protection isn’t one-size-fits-all. The decision should rest on how the stock has trended, how far it has fallen, and what it has done over this calendar window in past years, and on the investor’s own Risk, Return, & Regret® profile. We show the same framework on three S&P 500 names our AI analyst surfaced in under a second.
The question I keep getting
“I’ve got a stock that’s run up. I’m a little nervous. Should I buy some puts? Should I sell covered calls? Or should I just ride it out?”
I hear some version of that every week, from advisors and from investors managing their own money. Right now I’m hearing it more than usual.
For the past several weeks I’ve written about covered calls. This week I want to take a detour, because of the environment. The midterms are next week. The war with Iran continues, the Russia-Ukraine war grinds on, and geopolitical risk seems to be everywhere. Interest rates are still high. People have gains they don’t want to give back, they don’t want to sell, and they are worried. In this environment the strategy I find myself recommending most often is a zero-cost put spread collar. And the thing that surprises almost everyone who sees one for the first time is how much upside they get to keep.
To make it concrete, I’ll start with the ten stocks in the Cboe Mag 10: the Magnificent 7 plus Palantir, Broadcom, and AMD. Then I’ll apply the same framework to a screen of the S&P 500. Everything below comes from the Volworks platform as of October 26.
Start with the stocks, not the options
Before deciding how to protect a stock, look at how it has actually behaved. Two reports do most of that work.
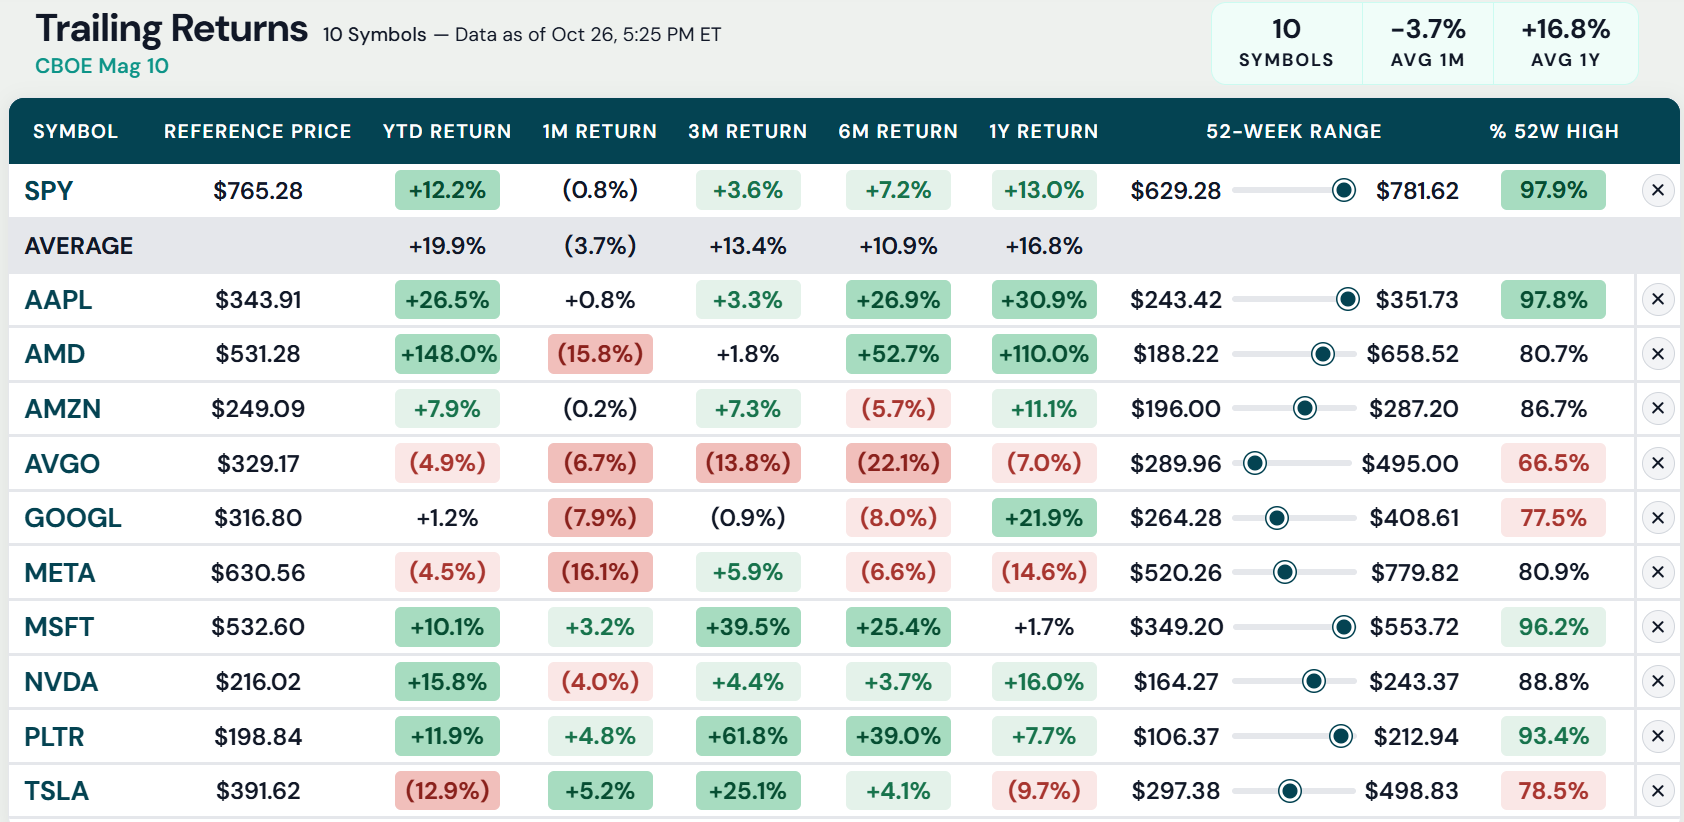
The trailing returns show which names have been running and which have stalled. The group is up 16.8% on average over the past year against 13.0% for SPY, but the dispersion is wide. AMD is up 110% over 12 months and 148% year to date. Palantir is up 62% in three months, Microsoft 40%. On the other side, Broadcom is down 22% over six months, and Meta and AMD both fell about 16% in the past month alone.
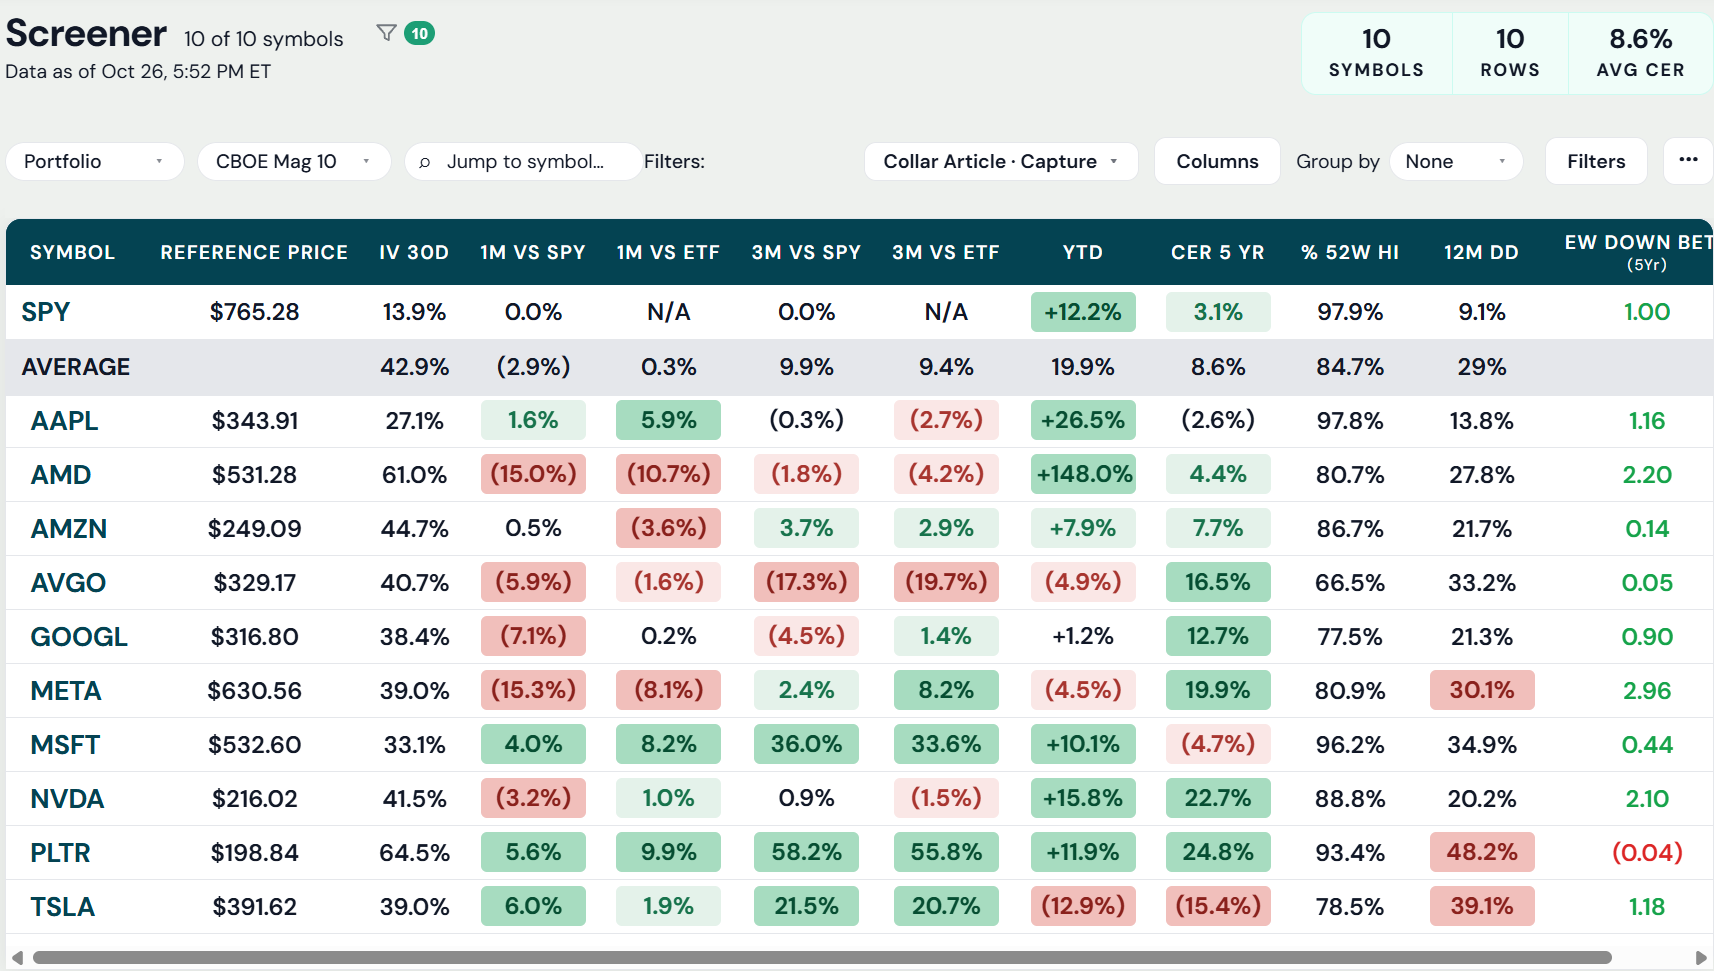
The screener adds the risk side. A few columns matter most for a protection decision:
- 12-month drawdown. The average peak-to-trough decline over the past year is 29%, versus 9% for SPY. Palantir fell 48% at one point, Tesla 39%, Microsoft 35%. Apple fell only 14%.
- Downside beta (5-year, exponentially weighted). How hard the stock falls when the market falls. Meta at 2.96, AMD at 2.20, and Nvidia at 2.10 have historically dropped two to three times as much as the market on down days. Broadcom, Amazon, and Palantir have barely tracked it.
- 30-day implied volatility. The options market’s estimate of how much each stock will move. The group averages 43% against 14% for SPY. Higher volatility means more expensive puts, but also richer calls to pay for them.
- CER (contextual expiration return). This is a Volworks metric: the stock’s five-year, recency-weighted average return over this exact calendar window, the next six months. Nvidia’s is +22.7%, Palantir’s +24.8%, Meta’s +19.9%. Tesla’s is −15.4%, Microsoft’s −4.7%, and Apple’s −2.6%. In other words, some of these names have historically done well from late October into April, and some have not.
No single column tells you what to do. Together they tell you which stocks have the most to protect, and which have the most room to run.
They don’t move together
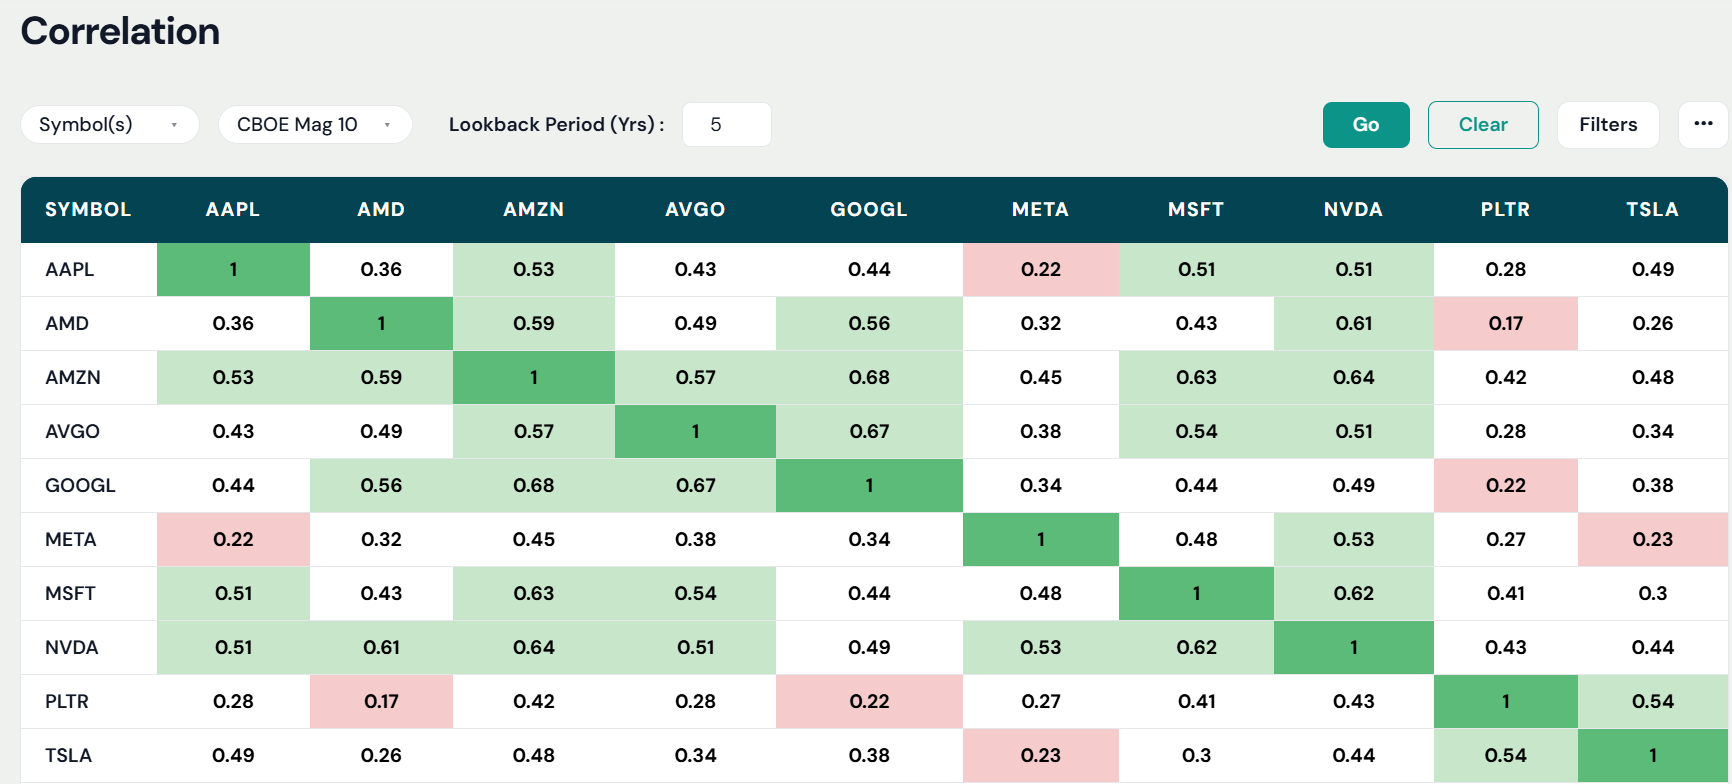
People tend to think of these ten stocks as one trade. They aren’t. Over five years the average pairwise correlation is only about 0.45. Amazon and Alphabet move together (0.68), and so do Alphabet and Broadcom (0.67). But AMD and Palantir are nearly unrelated (0.17), and Apple and Meta have a surprisingly low correlation to each other (0.22).
That matters for hedging. Buying puts on the Nasdaq to protect a Palantir position is a loose fit at best. If you want to protect a specific stock, the cleanest way is to hedge that stock.
What a zero-cost put spread collar is
You own the stock. Three things happen on top of it:
- You buy a put at about 95% of today’s price. That’s your insurance. You take the first 5% decline yourself.
- You sell a put at 80% of today’s price (or 85%, in the lighter version). That lowers the cost of the insurance. Below that level you’re back to owning the stock, but with the 15% or 10% of protection already banked.
- You sell a call above today’s price. The premium from that call pays for whatever the put spread still costs. The strike of that call becomes your cap.
Net cost: roughly zero. For the next six months you are protected from −5% to −20% (the 95/80 structure) or −5% to −15% (95/85), and you participate in the stock up to the cap.
Why not a traditional collar?
A traditional collar is simpler: buy a put, sell a call. The put protects you all the way to zero. That sounds better until you ask what it costs. Insurance against a fall to zero is expensive, and to pay for it you have to sell a call much closer to today’s price. The cap comes down, often dramatically.
For a company like Apple, Microsoft, or Nvidia, a six-month fall to zero isn’t the risk anyone is losing sleep over. The risk is a 15% or 25% drawdown in a nervous market. A 95/80 put spread collar insures exactly that: at expiration, you’re covered against the decline from −5% to −20%. You give up protection you were unlikely to need, and in exchange you keep a cap that leaves real room for the stock to run. For most investors in solid companies, that’s the right balance.
The only variable left is where the cap lands, and that depends on what the market will pay for the call. Which brings us to the part people underestimate.
How much upside you keep
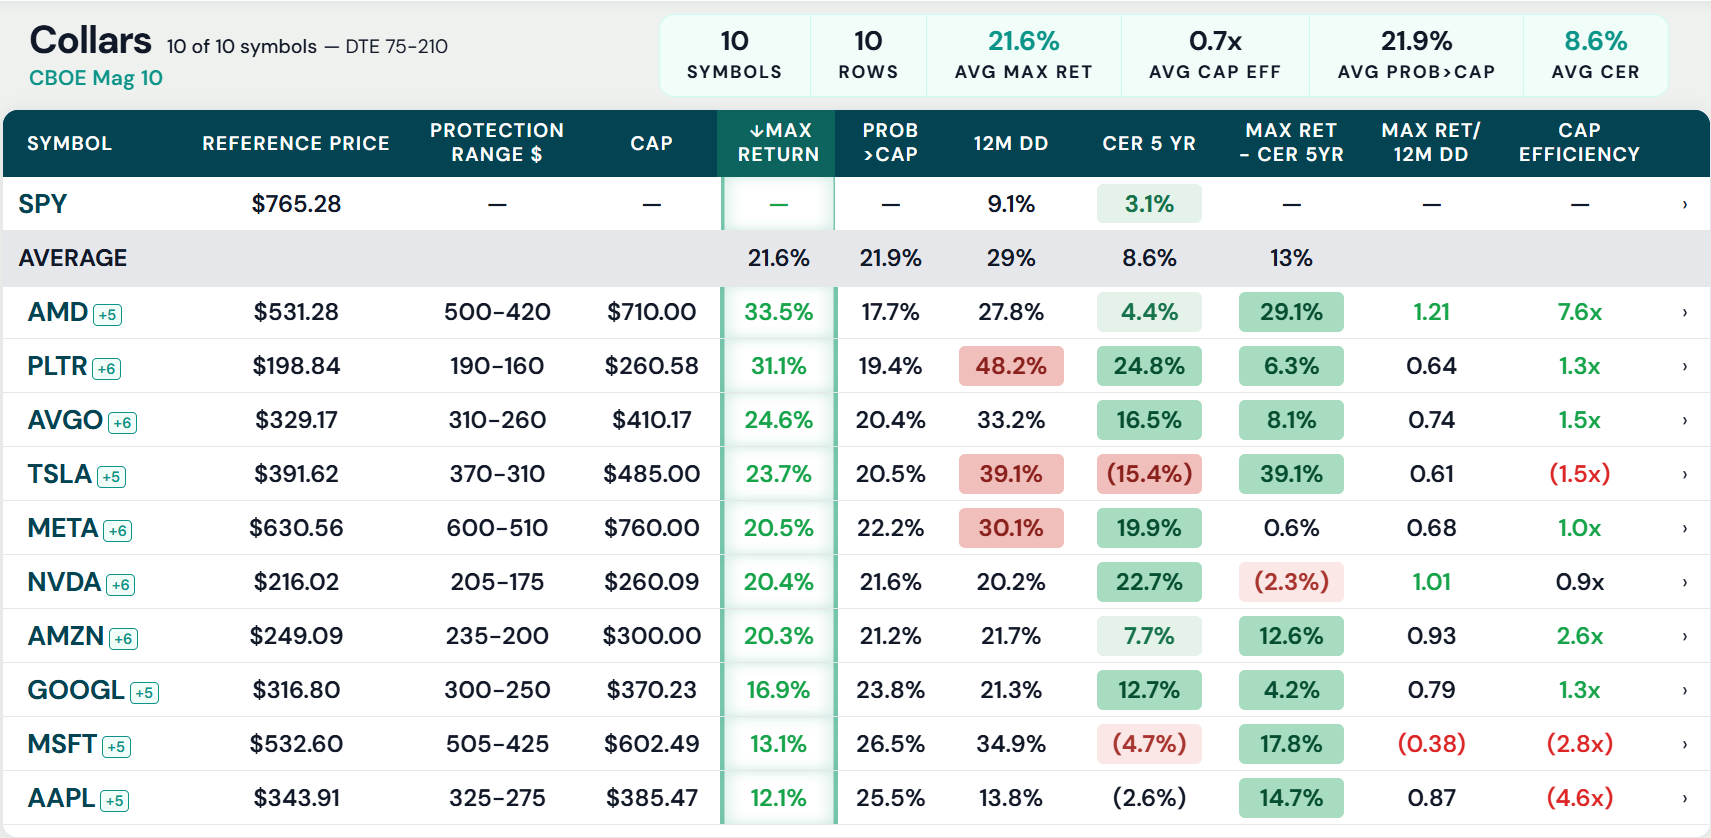
Here is the 171-day (roughly six-month) 95/80 collar on each of the ten names. Every one is priced at zero net cost. Look at the Max Return column.
AMD: you can protect the stock from −5% to −20% and still keep 33.5% of upside. Palantir, 31.1%. Broadcom, 24.6%. Tesla, 23.7%. Meta, Nvidia, and Amazon all around 20%. Even the lowest, Apple at 12.1%, is a full year of a good market’s return, kept over six months, with a 15 percent cushion underneath.
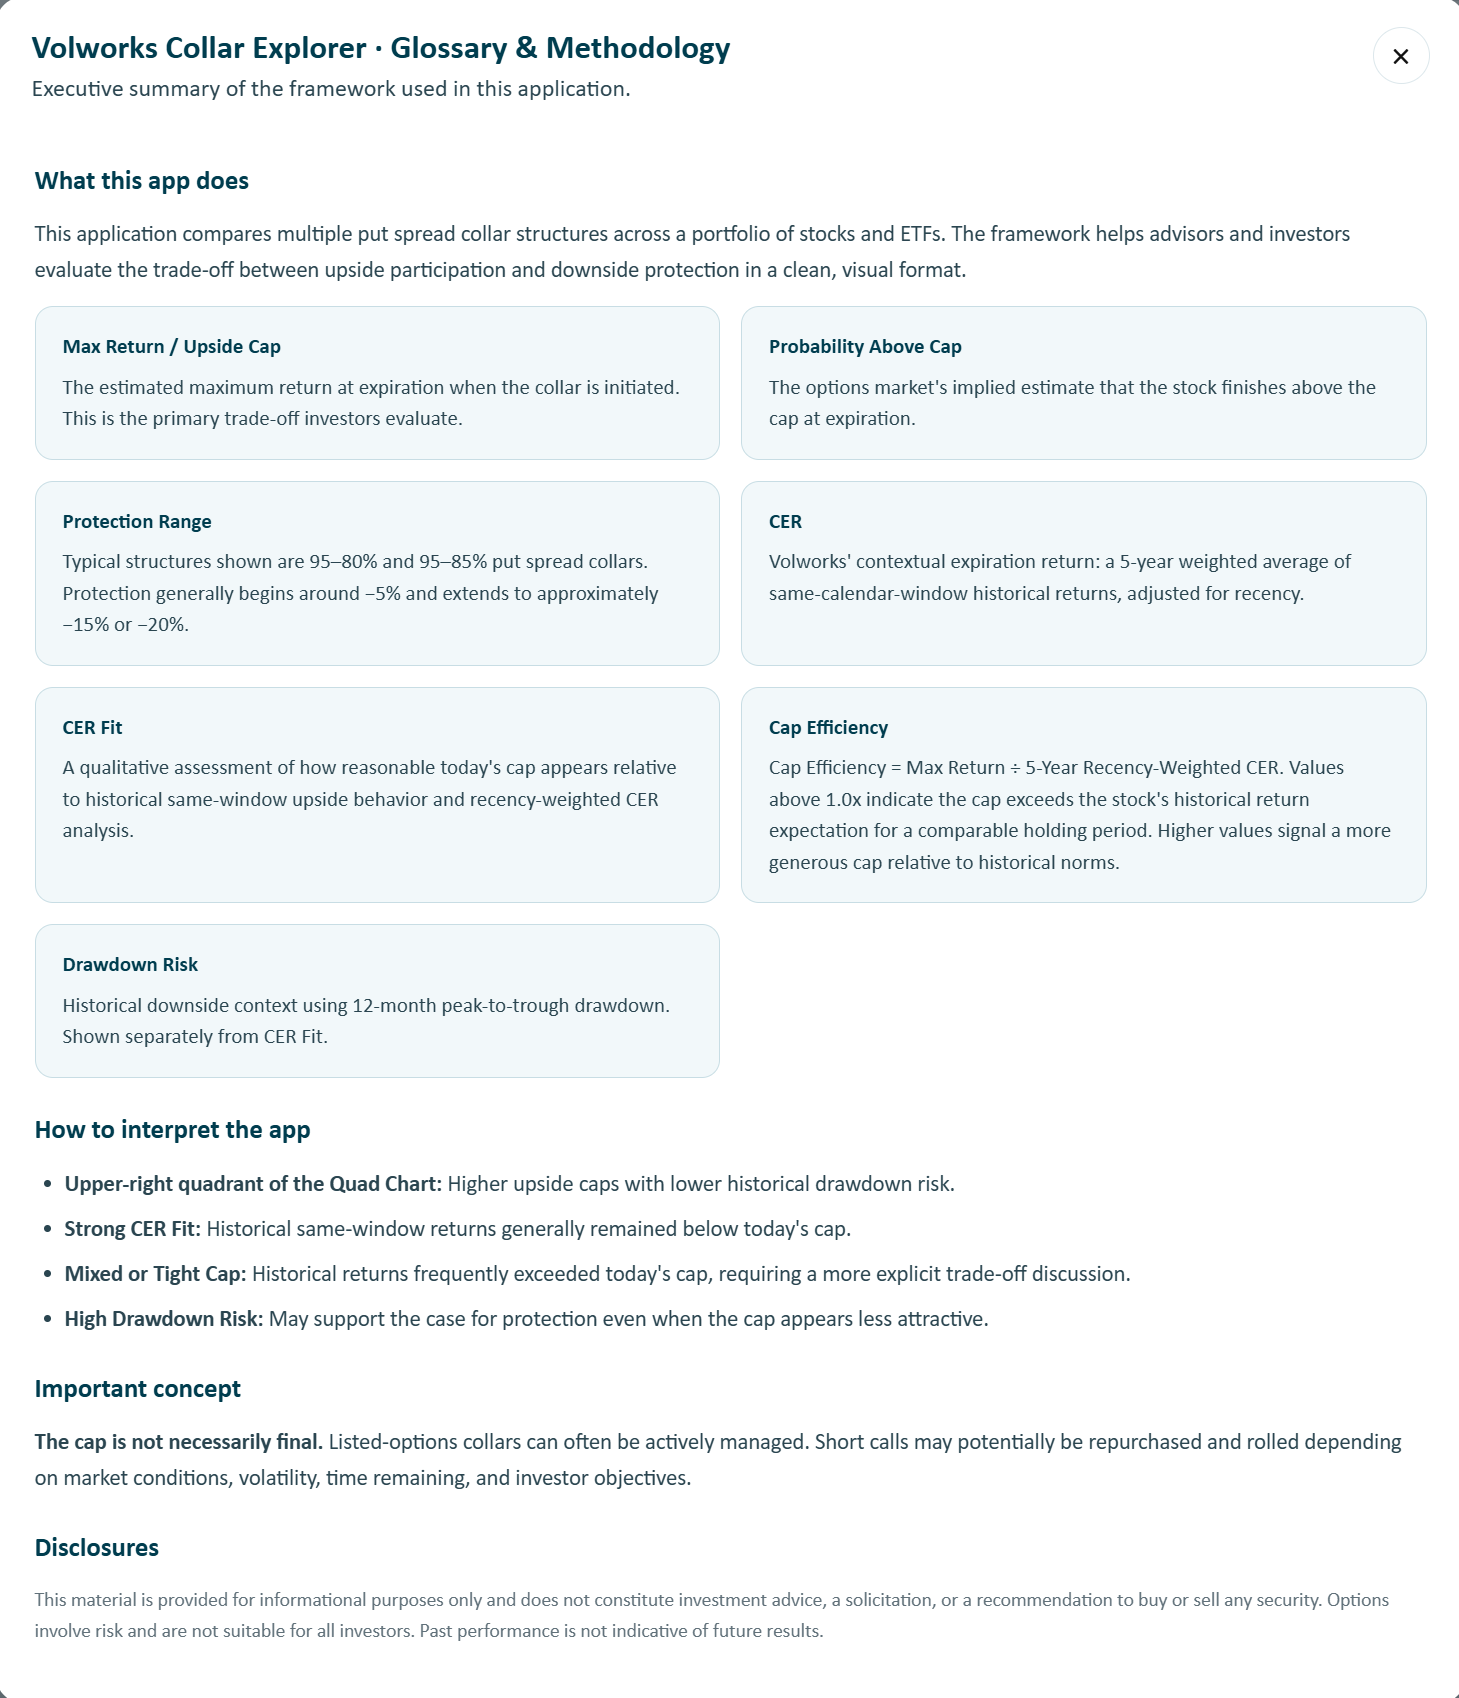
The report puts a few numbers next to that cap so you can judge whether it’s a reasonable one:
- Probability above cap is the options market’s own estimate of the chance the stock finishes above the cap at expiration. It runs from 18% (AMD) to 27% (Microsoft). Roughly three times out of four, the cap never comes into play.
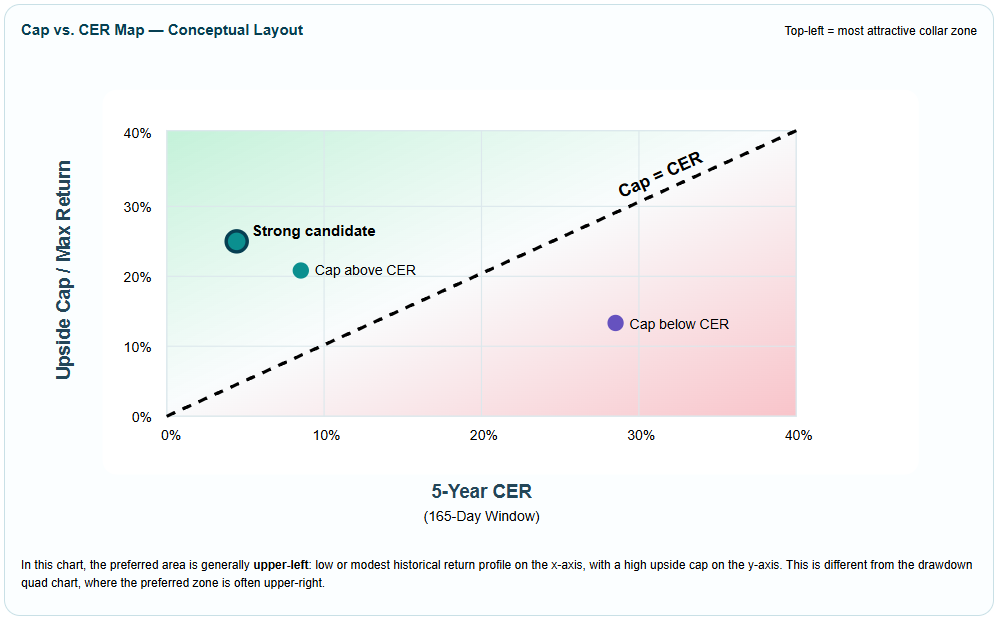
- CER shows what the stock has historically done over this same six-month window. For AMD, the cap is 33.5% and the five-year weighted history is 4.4%. For Nvidia, the cap is 20.4% and the history is 22.7%, so the cap is tighter relative to how the stock has behaved.
- Cap efficiency is just the ratio of the two. AMD’s 7.6x says the cap is far above its historical return for this window. Amazon’s 2.6x and Broadcom’s 1.5x are comfortable. A negative number, as with Tesla, Microsoft, and Apple, means the stock has historically lost money from late October into April. For those names the cap is a secondary concern. The protection is the point.
Not one size fits all
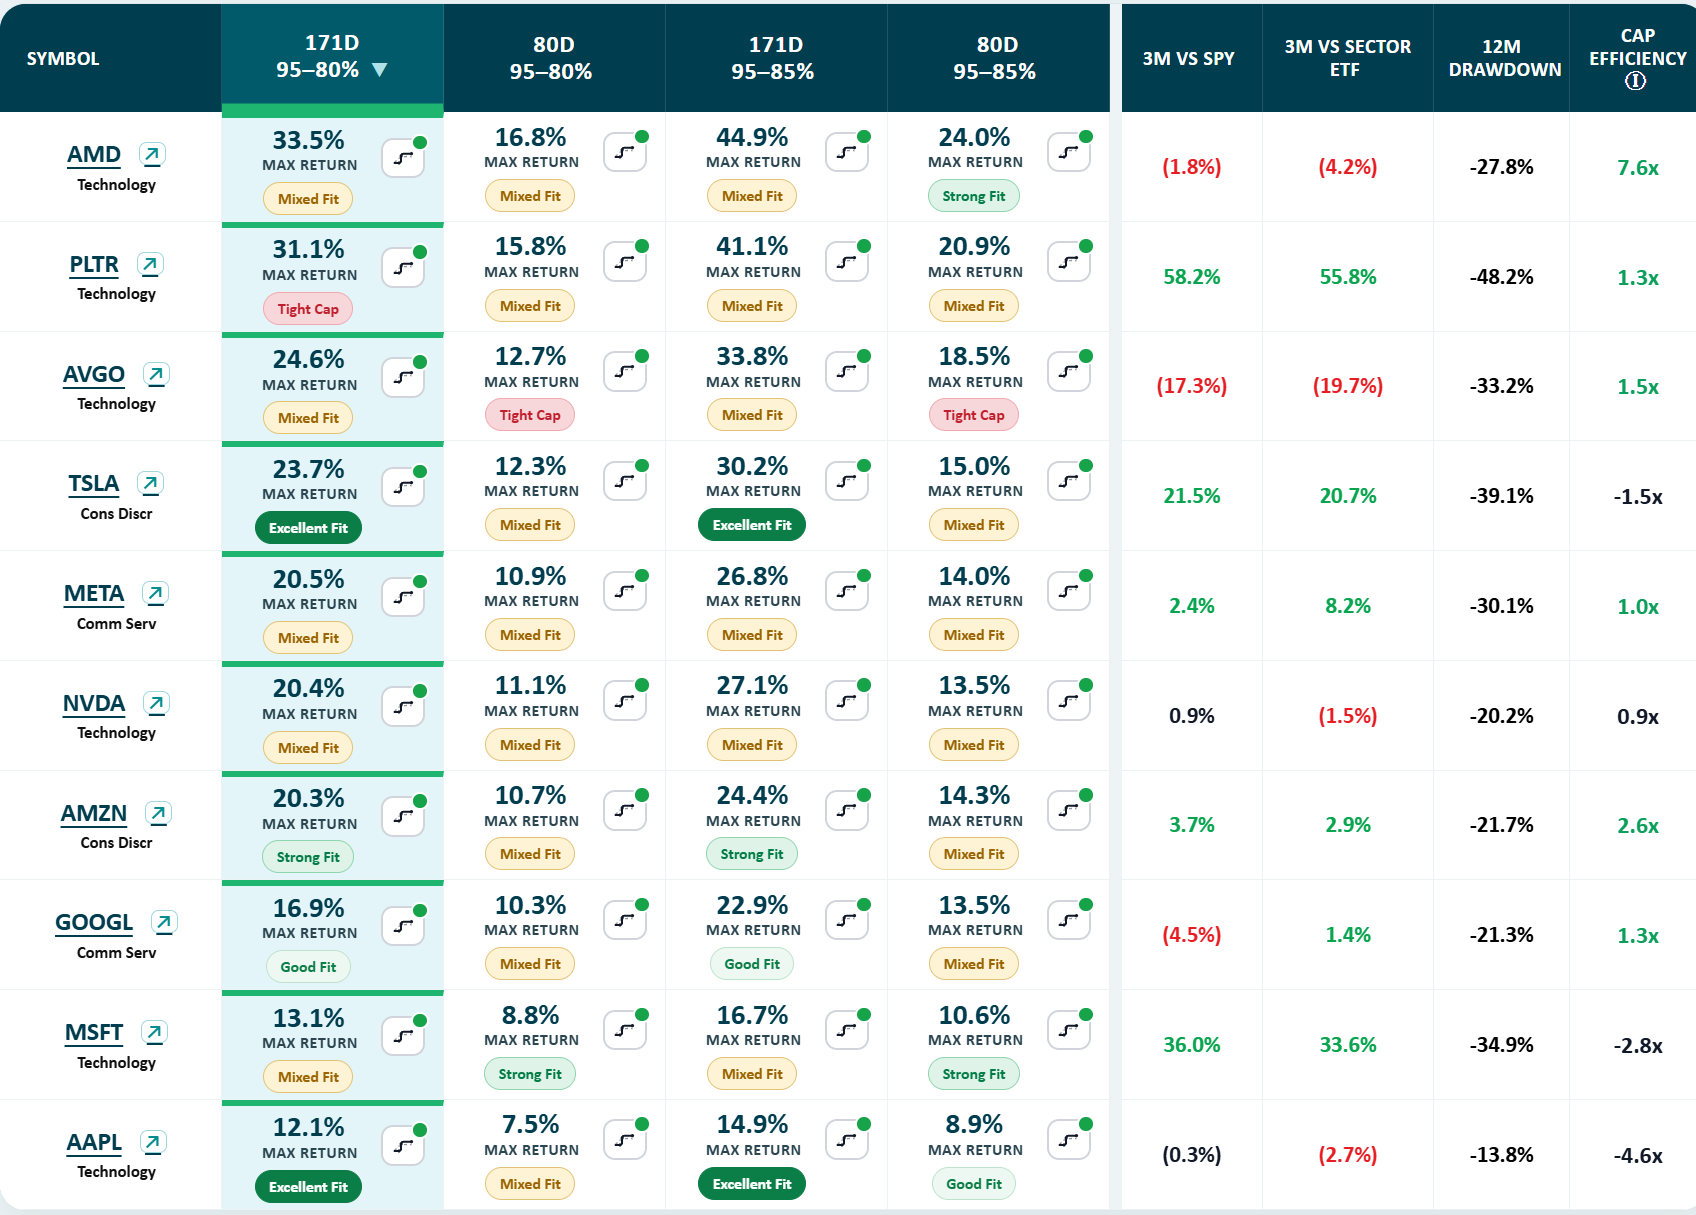
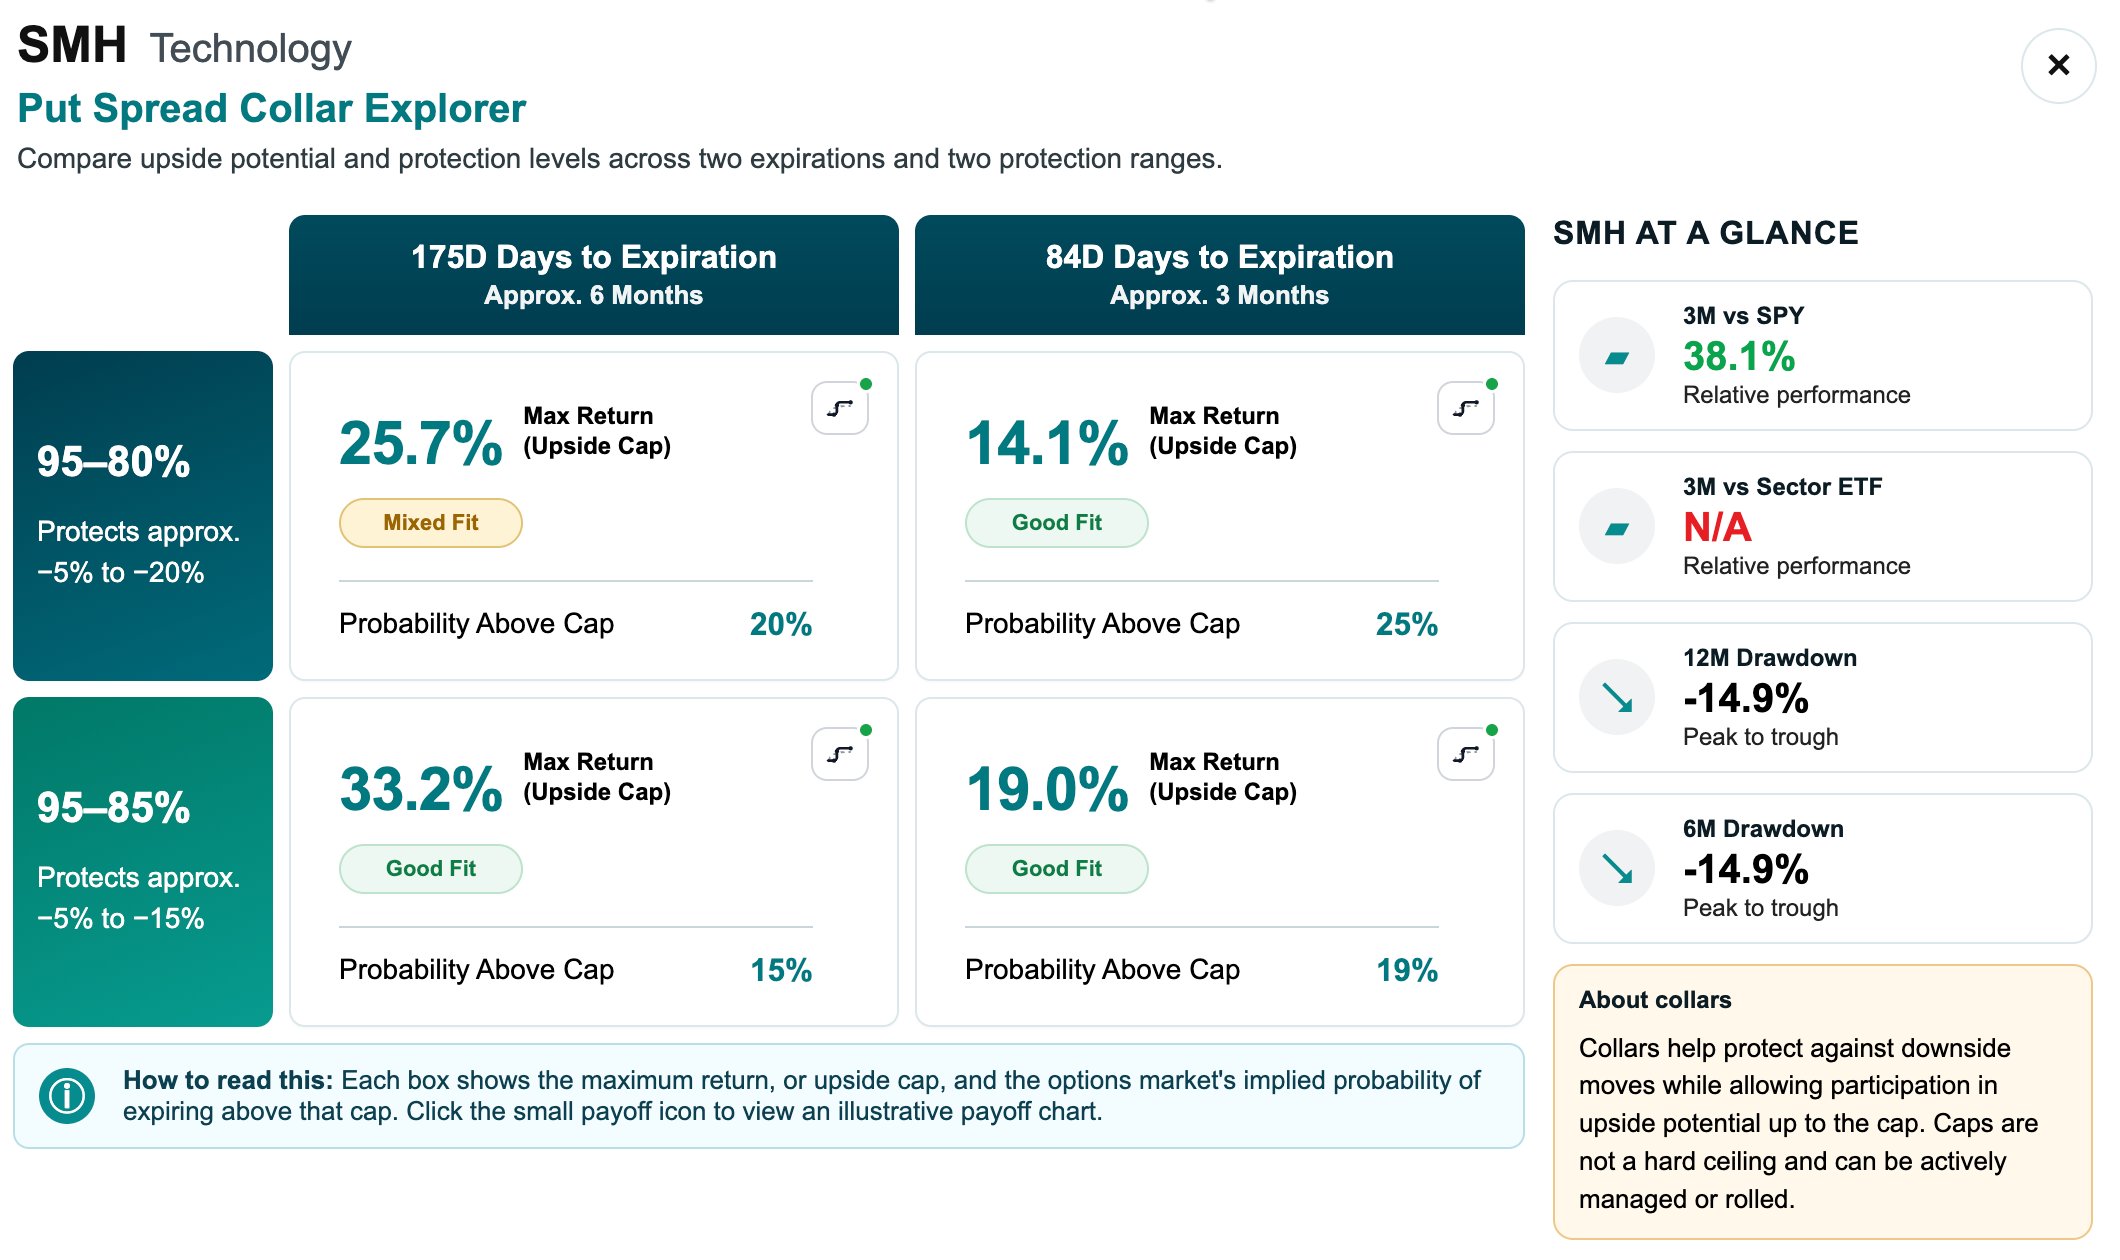
The Collar Explorer shows the same ten stocks across four structures: 171 days and 80 days, each at 95/80 and 95/85.
Two things stand out. First, less protection buys a lot more cap. Move Nvidia from 95/80 to 95/85 and the six-month cap goes from 20.4% to 27.1%. AMD goes from 33.5% to 44.9%. Alphabet from 16.9% to 22.9%. If a stock has historically had modest drawdowns, you may not need protection all the way down to 80% of spot. Taking the first 5% and insuring the next 10% can be the better trade.
Second, the fit label is doing something the cap alone can’t. It compares today’s cap with how the stock has behaved over this calendar window in each of the past five years. Excellent Fit (Tesla and Apple at 171 days) means history rarely cleared the cap, so you’re giving up little. Strong Fit (Amazon) is close behind. Mixed Fit means the stock has cleared the cap in some years and not others, which is a conversation worth having. Tight Cap (Palantir) means the stock has often run past the cap in this window. That doesn’t make it a bad trade, especially since Palantir also has the largest drawdown in the group. It just means the trade-off is real and should be made deliberately.
The 80-day columns show the same structures at a shorter horizon with roughly half the cap. Shorter collars cost less in forgone upside and are easier to adjust, at the price of resetting them more often.
One picture: upside kept vs. downside experienced
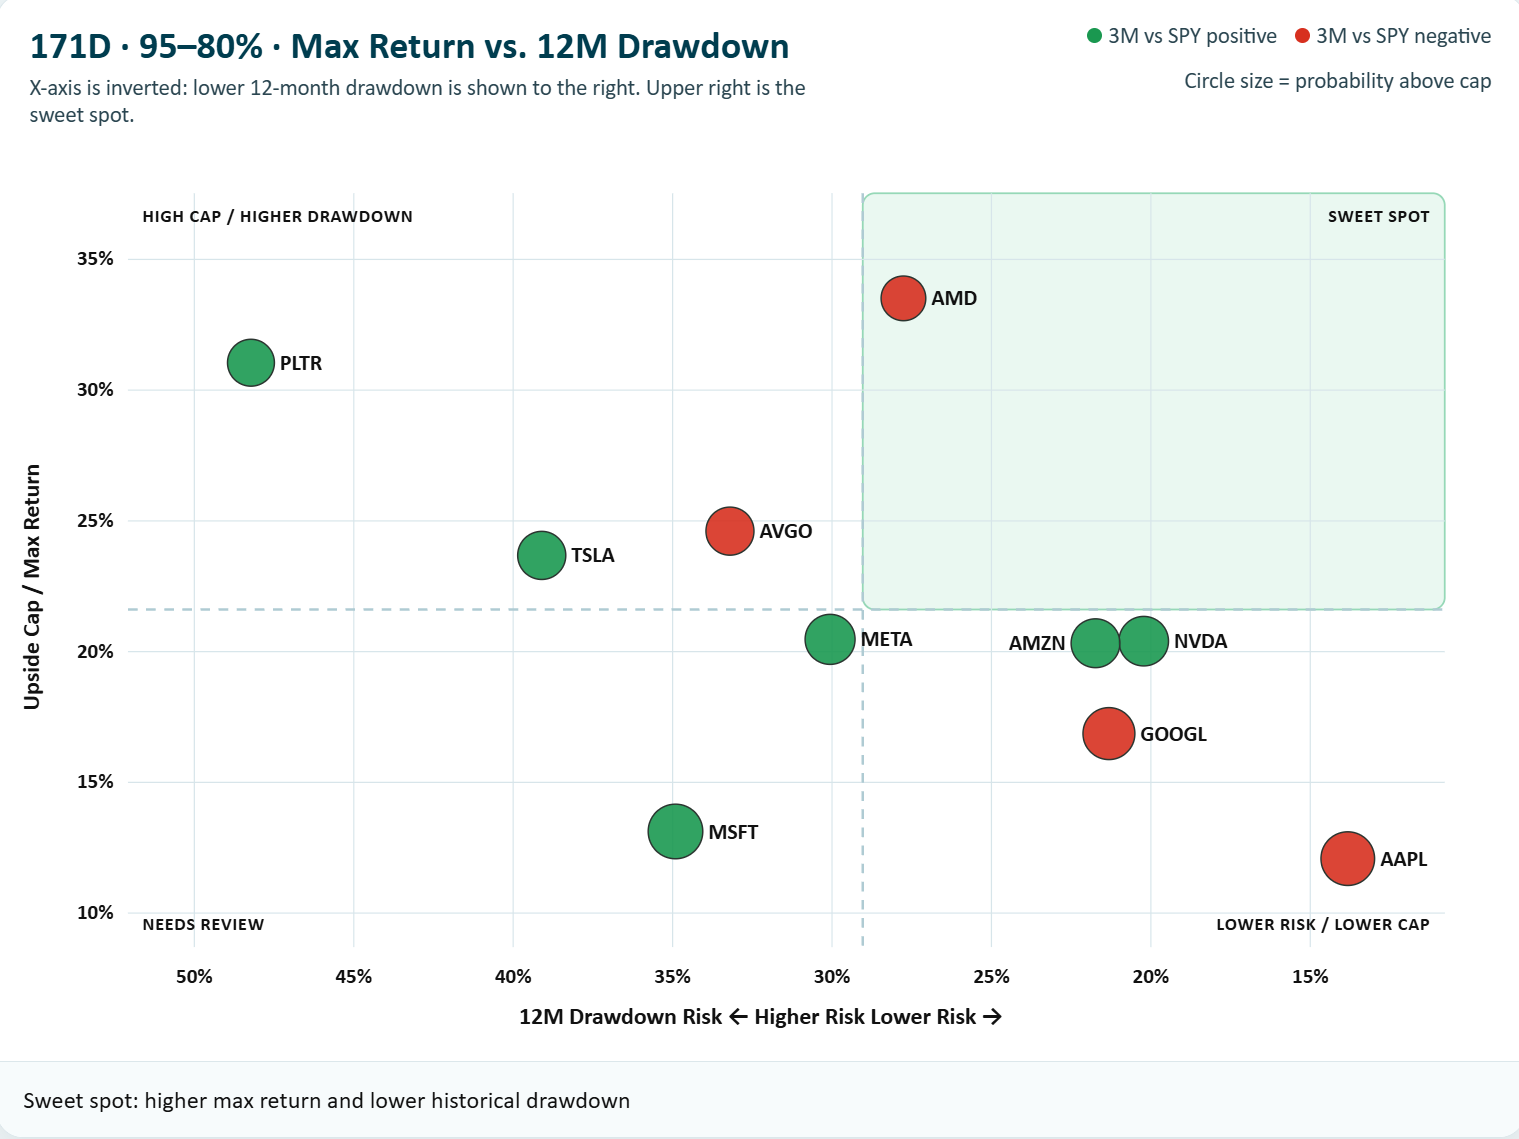
The quad chart puts the whole decision on one page. Up the left side is the cap, how much upside the collar leaves you. Across the bottom is the stock’s 12-month drawdown, with the axis flipped so lower risk sits to the right. Green circles outperformed SPY over the past three months; red ones lagged. Bigger circles have a higher probability of finishing above the cap.
The upper right is the sweet spot: a generous cap on a stock that hasn’t fallen much. At 171 days and 95/80, only AMD lands there, with a 33.5% cap against a 28% drawdown.
The other corners each tell a different story. Apple sits in the lower right: a modest 12% cap, but the smallest drawdown in the group, so it may need the least protection. Palantir sits in the upper left: a 31% cap next to a 48% drawdown, which is the strongest case for protection on the page even though the cap is tight. Microsoft sits in the lower left, with a 13% cap, a 35% drawdown, and a negative CER. That one needs a closer look before anything is done.
The chart doesn’t make the decision. It makes the trade-off visible, which is what most investors are missing when they ask whether to buy puts or sell calls.
Beyond the Mag 10: stocks that have actually been running
The Mag 10 are the names everyone talks about. But the question I get is usually about a stock that has been outperforming recently, whatever its name. So we ran a screen.
We started with the S&P 500 and kept only companies above $50 billion in market cap, which left 226 stocks. Then we asked for the names in the top 20% on all four of these at once: 1-month and 3-month performance versus the S&P 500, and 1-month and 3-month performance versus their own sector ETF. In plain terms, stocks that have been beating both the market and their peers for at least the past three months.
We asked VERA™, our AI analyst, in a sentence. The answer came back in under a second.
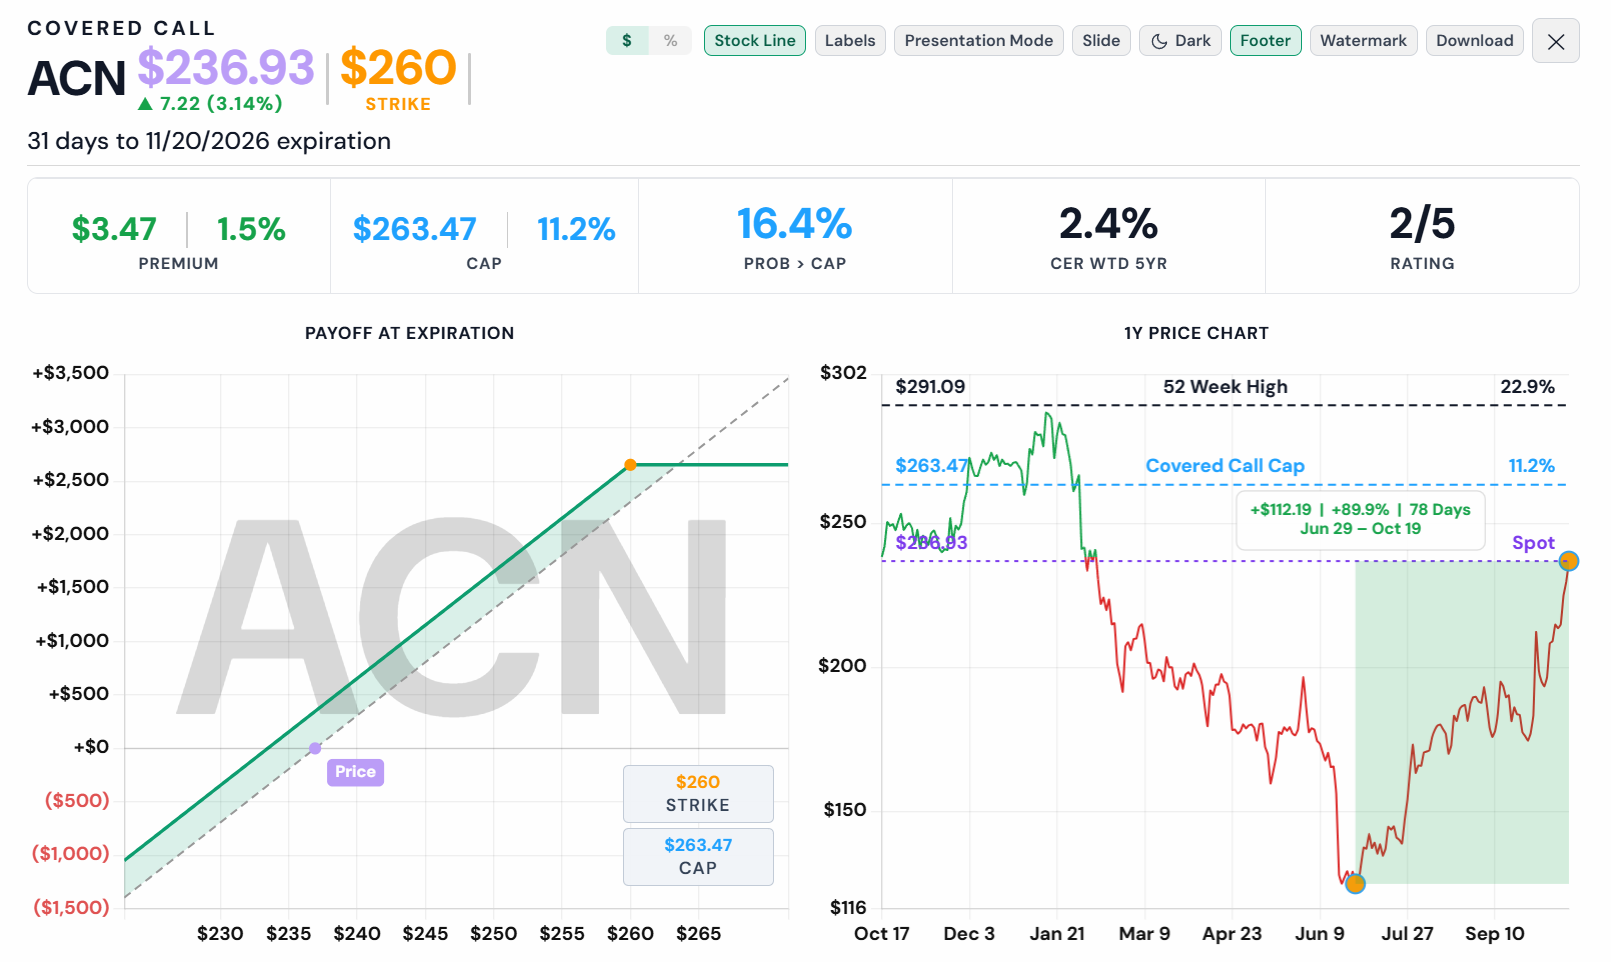
Seven stocks made the cut: Accenture, ServiceNow, CME Group, ADP, IBM, Nasdaq, and American Tower. Some of these are still down for the year. They are on the list because of recent relative strength, not because they’ve been winners for twelve months, and that is exactly the kind of stock people ask me about collaring.
Of the seven, only three (Accenture, IBM, and ServiceNow) have enough liquidity in listed options to collar properly. These three don’t have a 171-day expiration listed, so here is the nearest one, the 206-day 95/80 collar on each, with the same metrics we used on the Mag 10 stocks.

Look at the drawdowns next to the caps. Accenture and ServiceNow both fell more than 56% over the past twelve months, and both carry a negative CER for this window. They have run hard recently, but they are coming off a very deep hole. For a holder of either, a collar with a 25% or 34% cap and protection from −5% to −20% is a way to stay in the recovery without reliving the drawdown. IBM is a different animal: a 37% drawdown, a 20% cap, and a cap efficiency of 24.7x. That number needs a caveat. IBM’s CER for this window is only 0.8%, so dividing the cap by it produces a very large ratio. The honest reading is simpler: the stock has historically gone roughly nowhere from late October into May, so a 20% cap is unlikely to bind.
There are many ways to collar a stock. This is one, at one set of strikes, at one horizon. The point is the process: start with how the stock has behaved, then look at what the market will pay you for the cap.
Why we call it a soft cap
The cap is not a wall. The short call that sets it can be bought back and resold at a higher strike and later date, the same way a covered call is rolled. If AMD runs through $710 in February, the call can be rolled up and out, often for a small net cost or close to even, and the position keeps participating.
That’s the part a static payoff diagram never shows, and it’s the part our OPMS platform was built for. It watches every collar position, flags when a roll makes sense, and shows the cost of doing it. Managed that way, a collar stops being a one-time bet on a cap and becomes an ongoing position with protection underneath.
Better decisions, not just more trades
Nothing above is a recommendation to collar any of these stocks. The point is that the decision should rest on data about the stock you own: how it has trended, how far it has fallen, how it behaves in down markets, what it has done over this calendar window in past years, and what the market will pay you for the cap.
That’s why the platform carries more than 100 analytics: technical, fundamental, proprietary, probability-based, and return-based. No single set of them works for every investor. Different people weigh different things, and every investor has their own Risk, Return, & Regret® profile. Someone who would regret a 20% loss more than they’d regret a capped gain should see the 95/80. Someone who has lived through a 48% drawdown in Palantir and held on may be comfortable with the 95/85 and the bigger cap.
If you own a stock that has run and you’re nervous about the next six months, you have more choices than selling, buying puts, or hoping. A zero-cost put spread collar lets you keep most of the upside while you wait to see how the midterms and the rest of it play out.
Want to see how a collar on one of your positions looks? Reply here or message me and we’ll run it on the platform.
View source glossary and methodology screenshot
Disclosures: This material is provided for informational purposes only and does not constitute investment advice, a solicitation, or a recommendation to buy or sell any security. Options involve risk and are not suitable for all investors. Past performance is not indicative of future results. Data as of October 26, 2026, from the Volworks platform.
About the author: Victor Viner is Founder & CEO of Volworks. He co-founded Volaris Advisors and founded V2 Capital, both SEC-registered investment advisers, where he served as President and Chief Investment Officer. Volaris ran discretionary covered call programs for family office and institutional clients and was acquired by Credit Suisse; V2 Capital managed a hedge fund, a liquid alternatives mutual fund, and separately managed accounts. He has over 25 years of institutional derivatives experience.