Two ways an Nvidia shareholder could use options right now: a put spread collar if you want protection, a Booster if you are willing to hold the downside. Here is what each one prices out at.
In brief
- Nvidia fell 4.3% on Monday to $178.67 while the nine other semiconductor stocks we track rose 8.0% on average. From its October 6 high, Nvidia is down 25.3%.
- Shareholders are going to land in very different places on what to do next. We have no opinion on the headlines. We do have two option structures worth pricing, depending on your view.
- If you want protection: a 101-day put spread collar protects the shares from $170 down to $145 and caps the return at 17.3% ($210). Narrow the protection to $150 and the cap rises to 20.1% ($215).
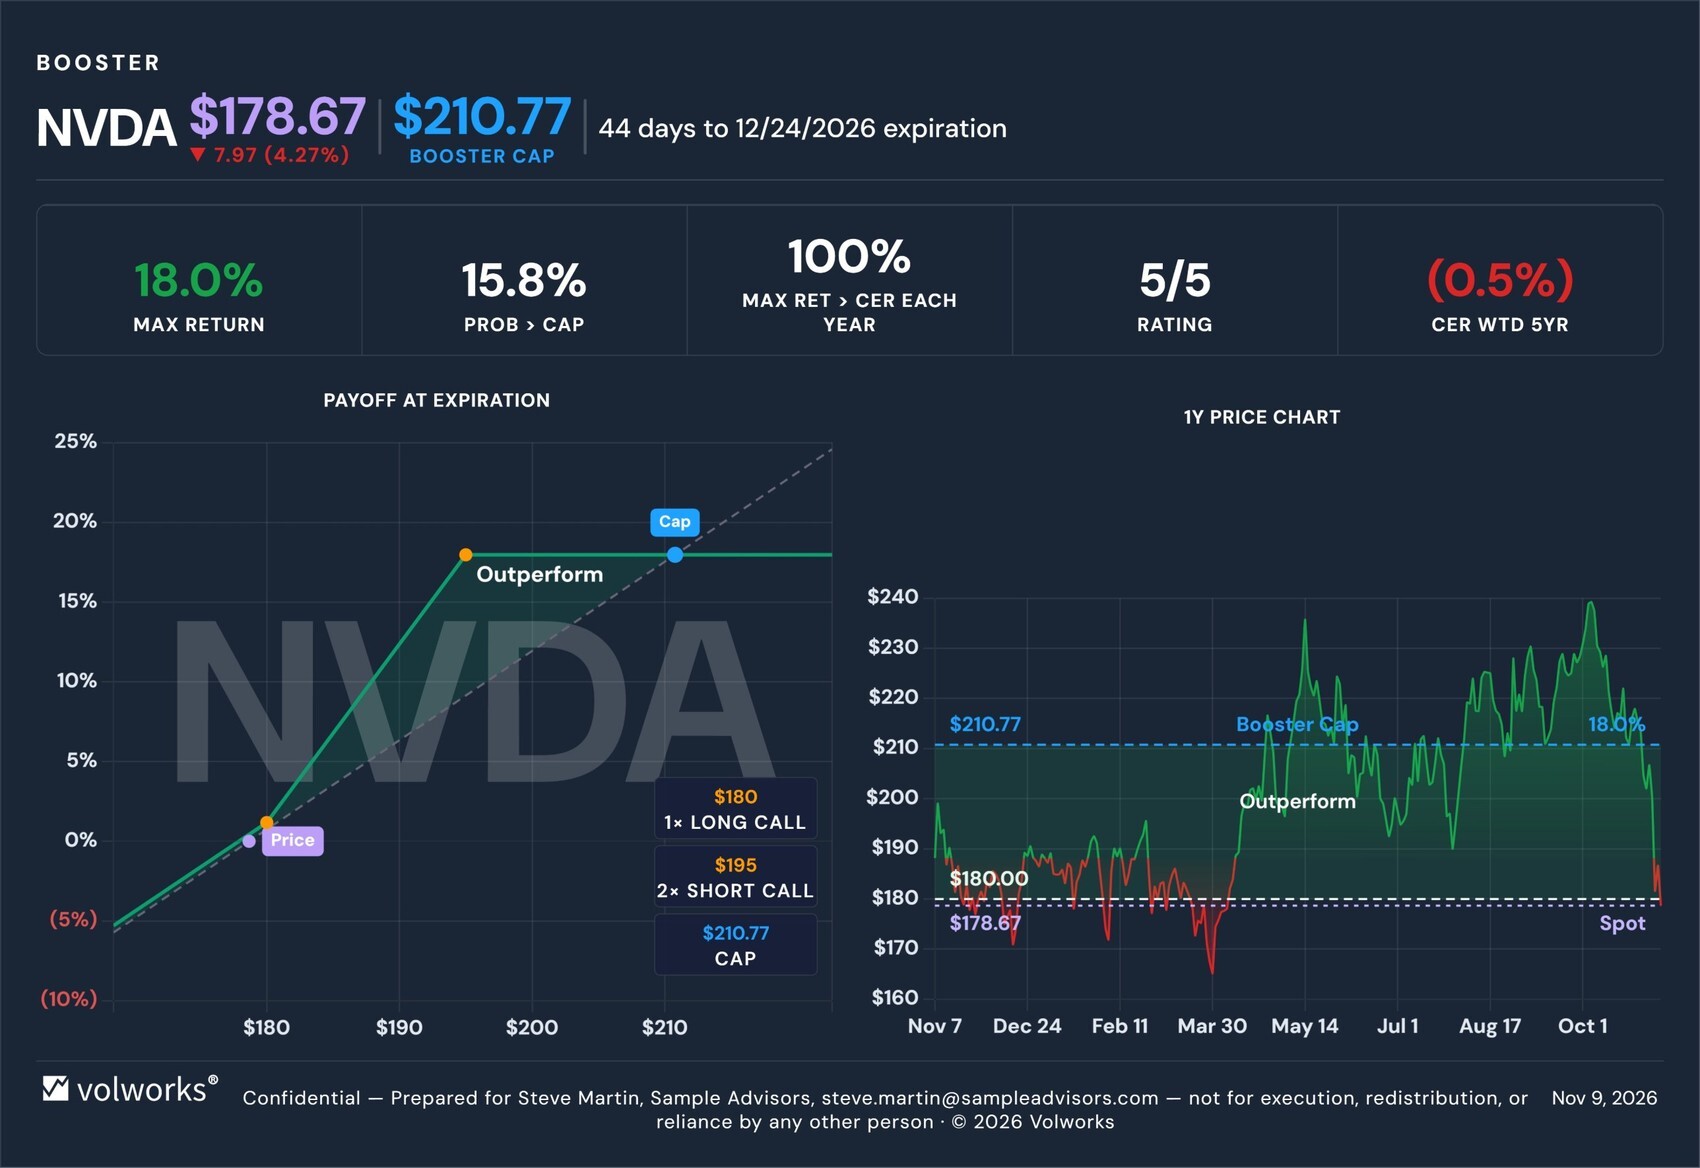
- If you will hold the downside: a 44-day Booster doubles the stock’s gain between $180 and $195, for a capped return of 18.0% at $210.77. Over the same 44-day window, Nvidia has averaged (0.5%) over the past five years.
- Nvidia reports earnings on November 17. Every trade shown here spans at least one earnings report. Nothing here is a recommendation.
The setup
Monday, November 9 was a strong day for semiconductors, with one exception. After Nvidia’s board announced an independent investigation involving its founder and CEO, Jensen Huang, the stock closed down 4.3% at $178.67. The nine other semiconductor stocks on our screen were all higher, by an average of 8.0%: AMD gained 13.2%, Lam Research 10.4%, KLA 9.3% and Broadcom 8.8%. The semiconductor ETF (SMH) rose 5.1%, the Nasdaq 100 (QQQ) 3.5% and the S&P 500 (SPY) 2.4%.
That is a gap of more than 12 percentage points between Nvidia and its average peer in a single session.
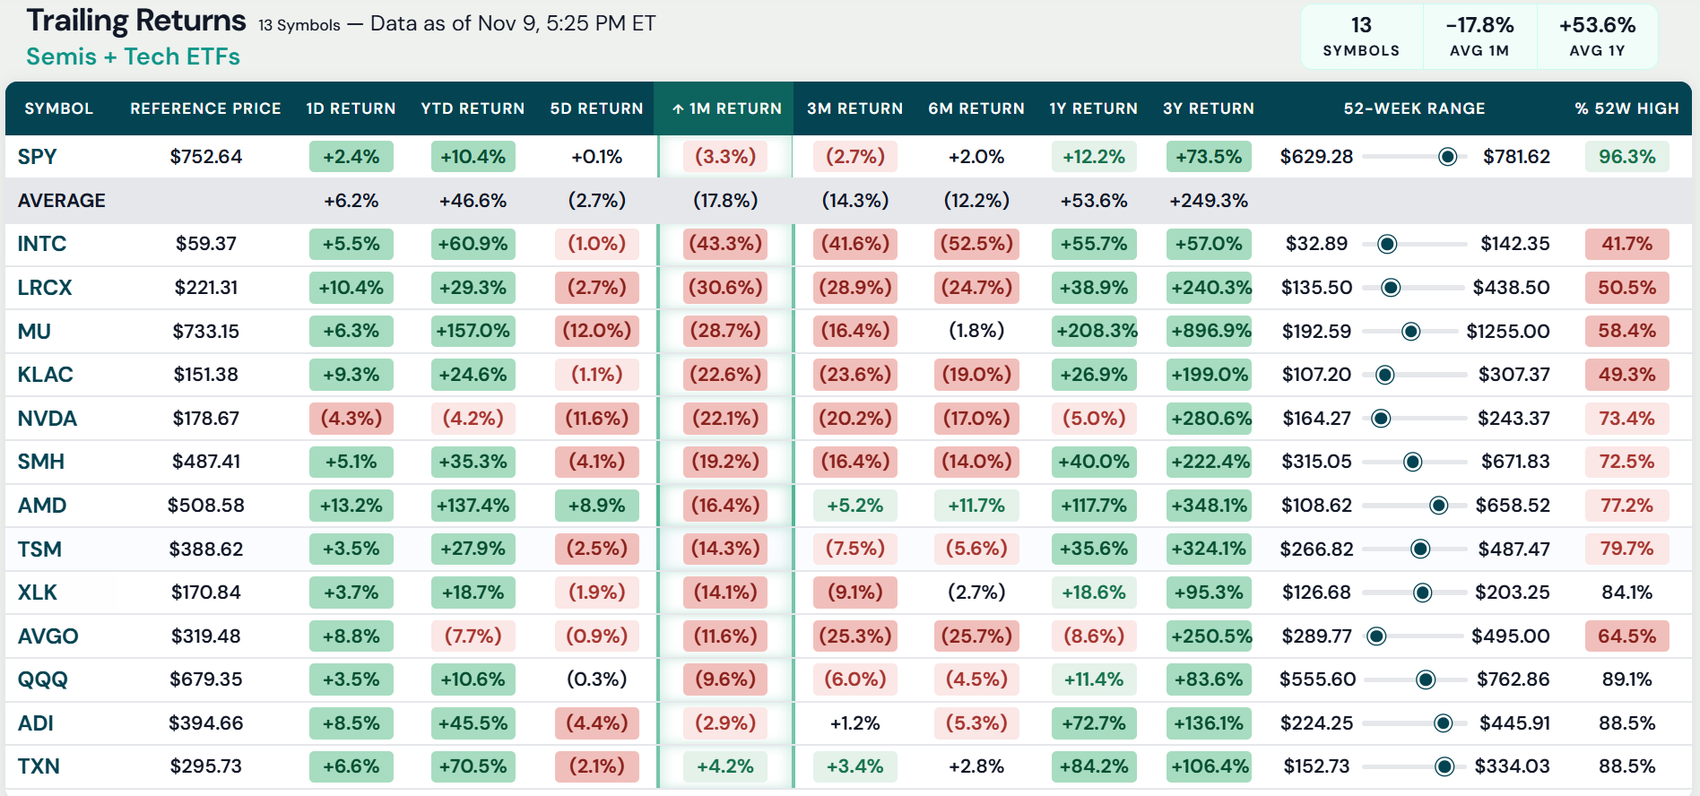
Note: The above table is sorted by 1-month trailing returns for additional context.
It also came on top of a hard month for the whole group. The 13 symbols in the screen are down 17.8% on average over the past month, and Nvidia is down 22.1%. On Monday, everything bounced except Nvidia.
Where Nvidia stands
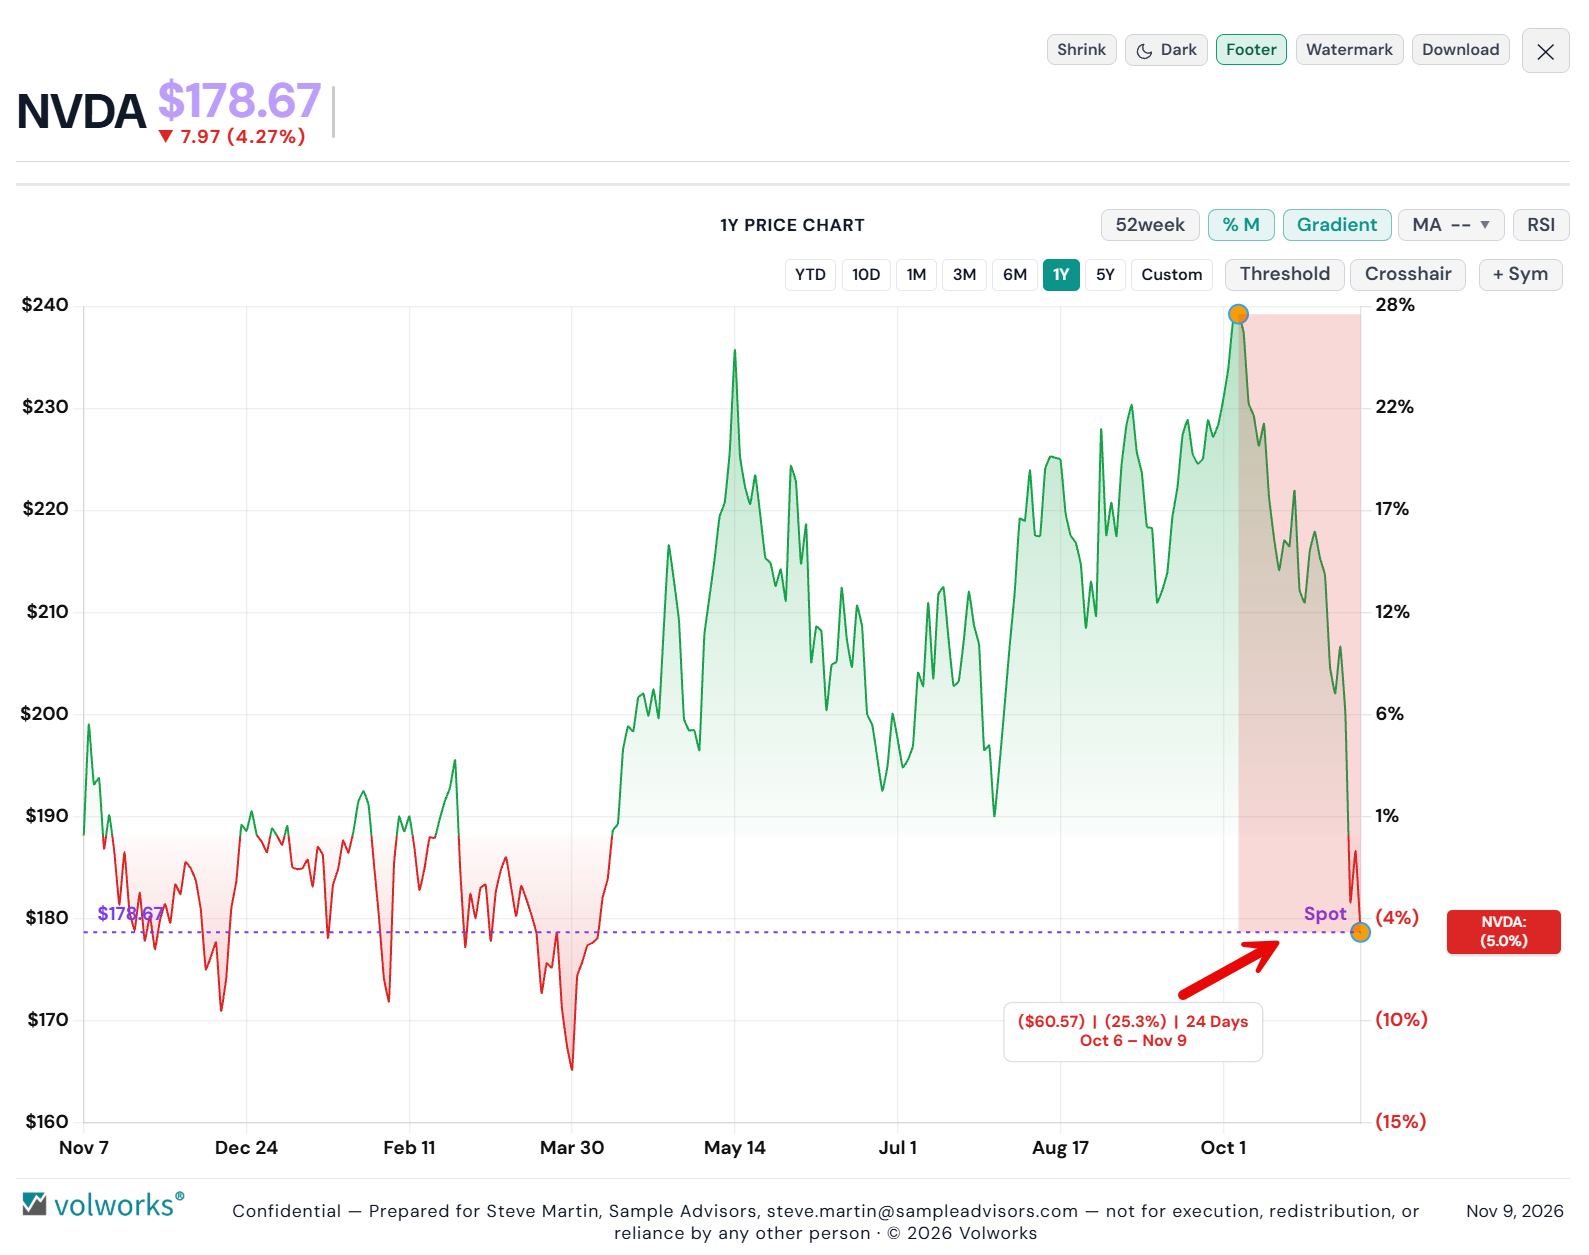
From its closing high on October 6 to Monday’s close, Nvidia has lost $60.57 a share, or 25.3%, in 24 trading days. It is now at 73% of its 52-week high and roughly 9% above its 52-week low of $164.27.
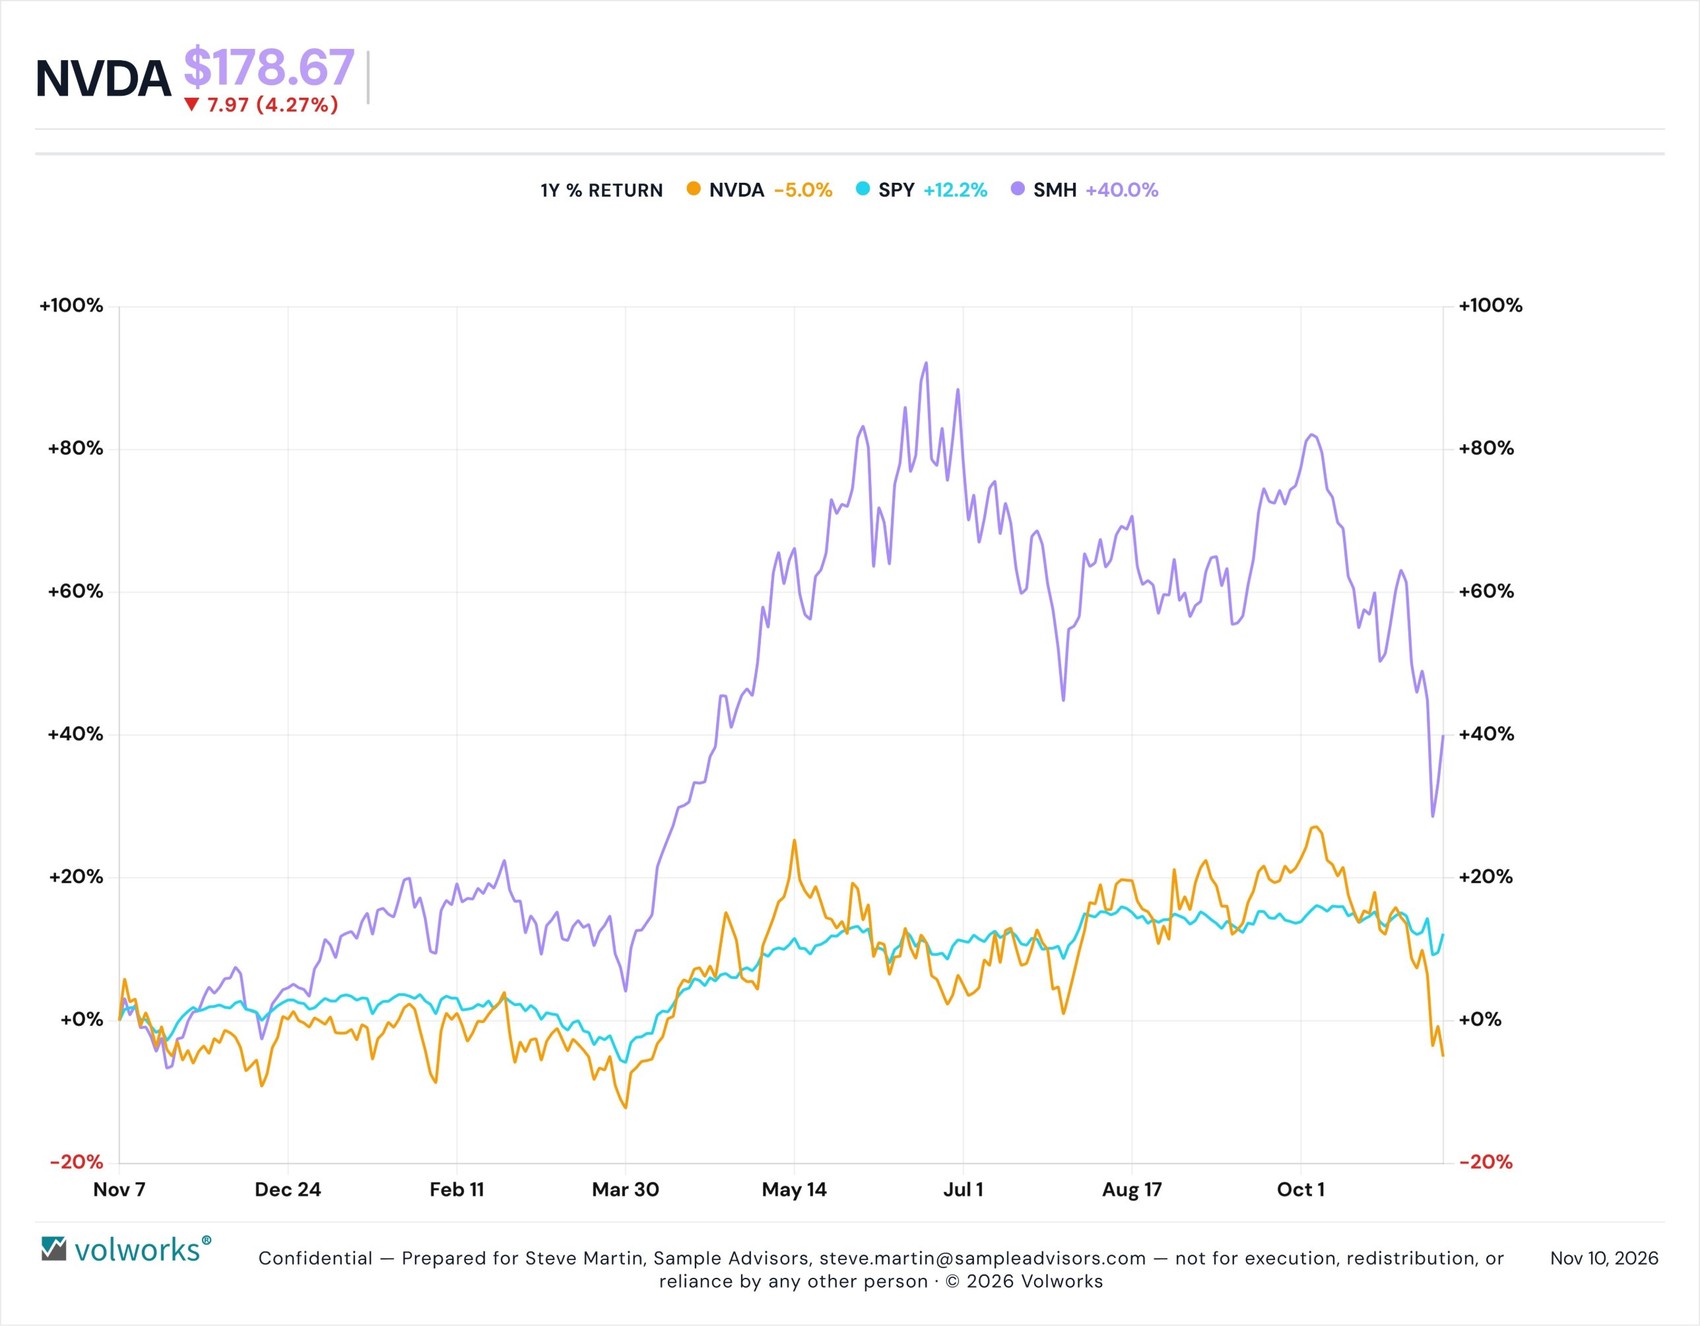
Over the past year Nvidia is down 5.0%. SMH is up 40.0% and SPY is up 12.2% over the same period. Nvidia is one of the largest holdings in SMH, so the ETF’s return already includes it. The rest of the group has carried the sector.
We are not here to offer a view on Nvidia’s leadership or what its board will do. Shareholders will form their own. What we can do is show how the options market lets you act on whichever view you hold, and what it costs.
What this time of year has looked like
Before pricing anything, we look at CER™, Volworks’ proprietary expiration return metric. For each upcoming expiration, it measures how the stock performed over the same calendar window in each of the past five years, then takes a weighted average adjusted for recency. It is a quick read on seasonality.
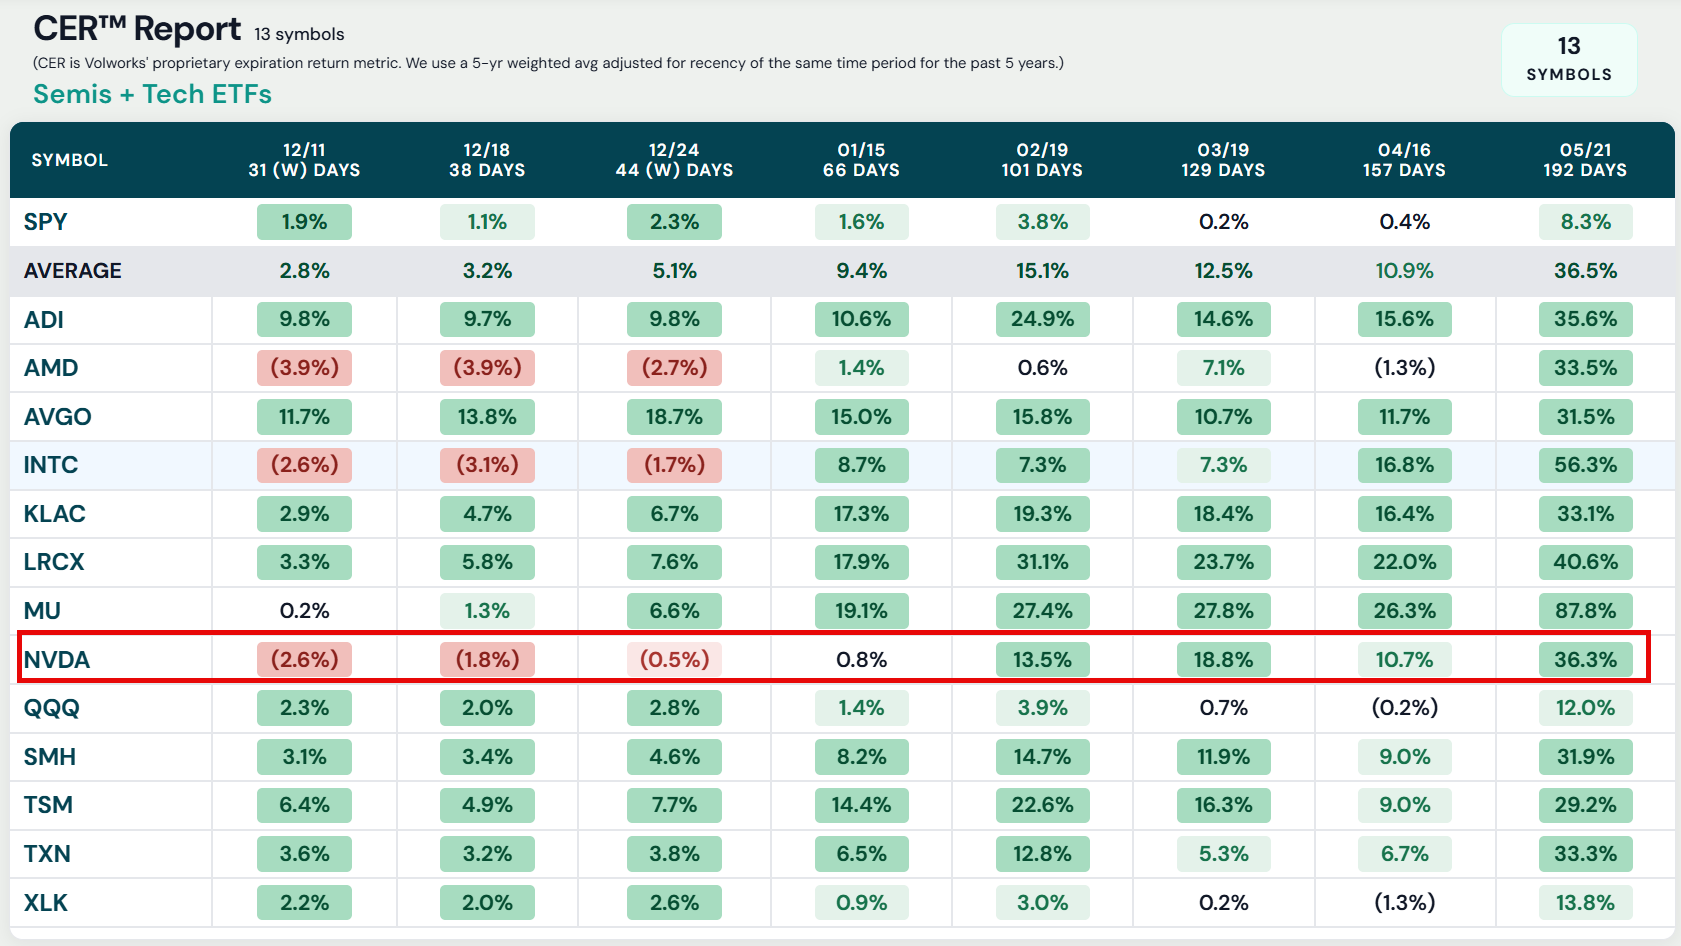
Nvidia’s row is negative for the three nearest expirations: (2.6%) at 31 days, (1.8%) at 38 days and (0.5%) at 44 days. At 66 days it is 0.8%, the lowest of the ten stocks. Only AMD and Intel look similar over the short windows.
Then the picture changes. At 101 days, Nvidia’s CER jumps to 13.5%, and at 129 days it is 18.8%. Historically, the weak stretch has been the next two months, not the next four. That shapes how we think about both trades below.
If you want protection: the put spread collar
A put spread collar is built around shares you already own. You buy a put slightly below the current price, sell a put further below it, and sell a call above the price to pay for the spread. The result is protection across a defined range, in exchange for a cap on the upside, typically at or near zero cost.
We priced two versions on Nvidia. Both start protection at $170, about 95% of the current price. One protects down to $145 (roughly 80% of the price) and the other down to $150 (roughly 85%).
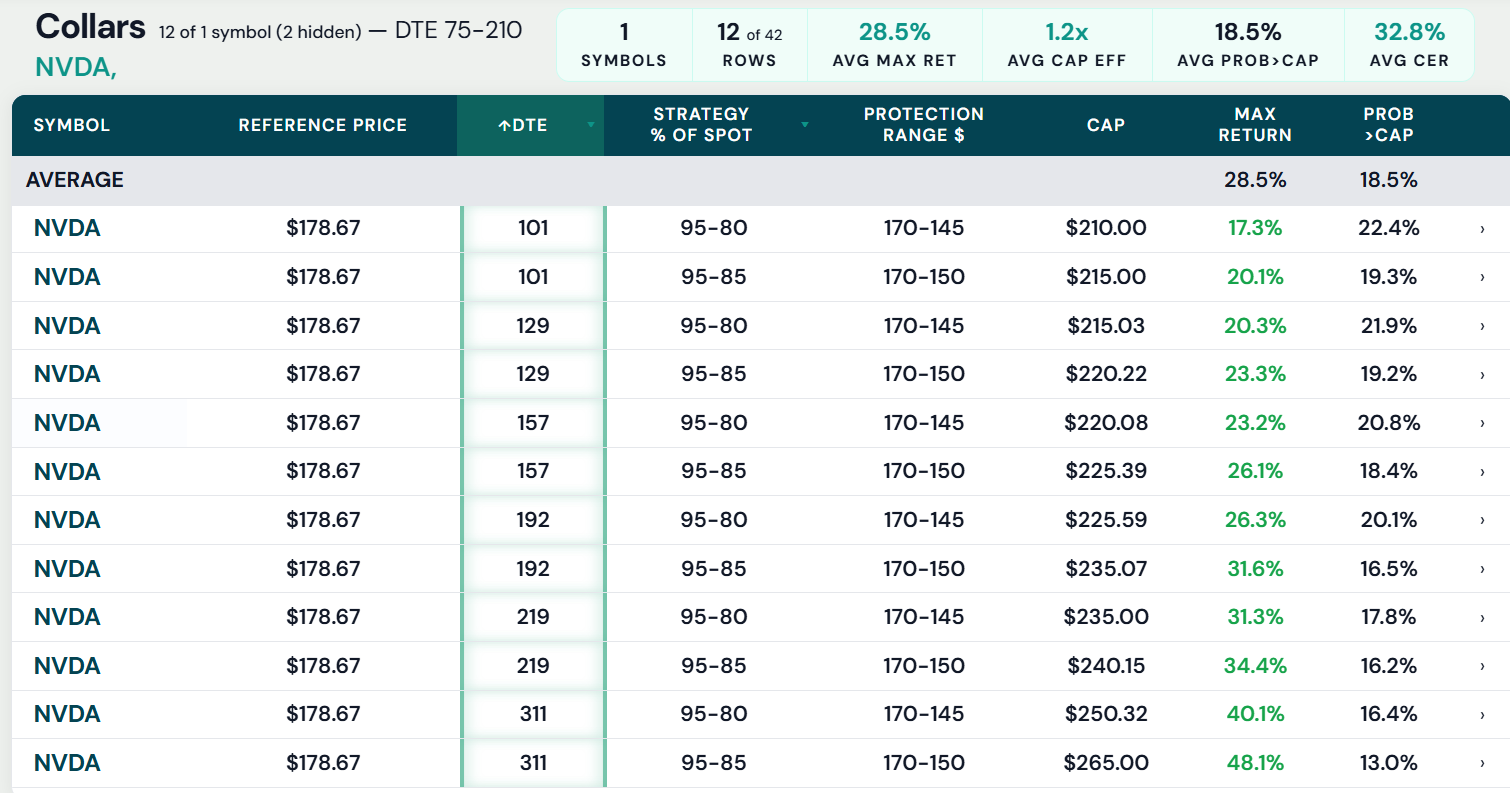
Take the 101-day expiration, February 19, 2027:
| 101 days | Protection range | Cap | Max return | Prob > cap |
|---|---|---|---|---|
| 95-80 collar | $170 to $145 | $210.00 | 17.3% | 22.4% |
| 95-85 collar | $170 to $150 | $215.00 | 20.1% | 19.3% |
With the 95-80 collar, the first 5% of any decline is yours. From $170 down to $145, a level 18.8% below Monday’s close and well under the 52-week low, the loss stays at about 5%. Below $145 you participate in the decline again, though still $25 a share better off than an unhedged holder.
The 95-85 collar gives up $5 of that protection and gets $5 more upside: the cap moves from $210 to $215, the maximum return from 17.3% to 20.1%, and the probability of finishing above the cap drops from 22.4% to 19.3%. If you are a little concerned but not very concerned, that trade-off may be worth a look.
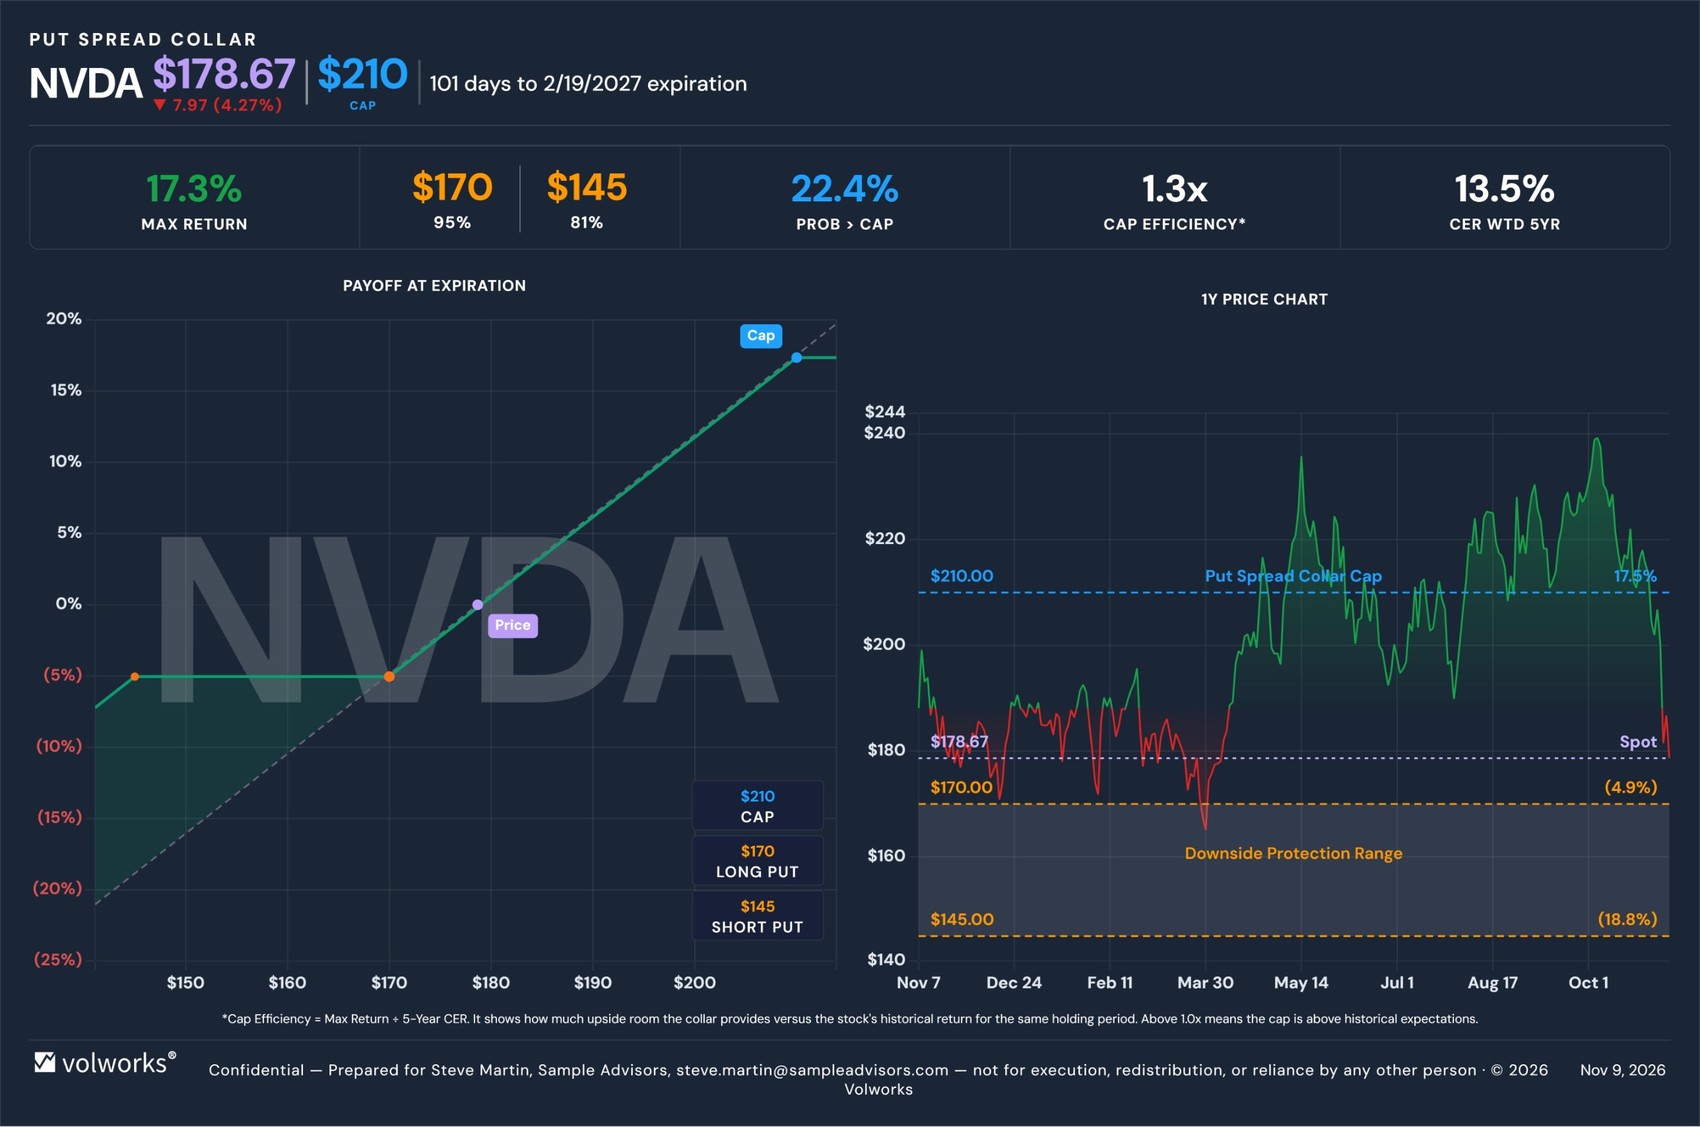
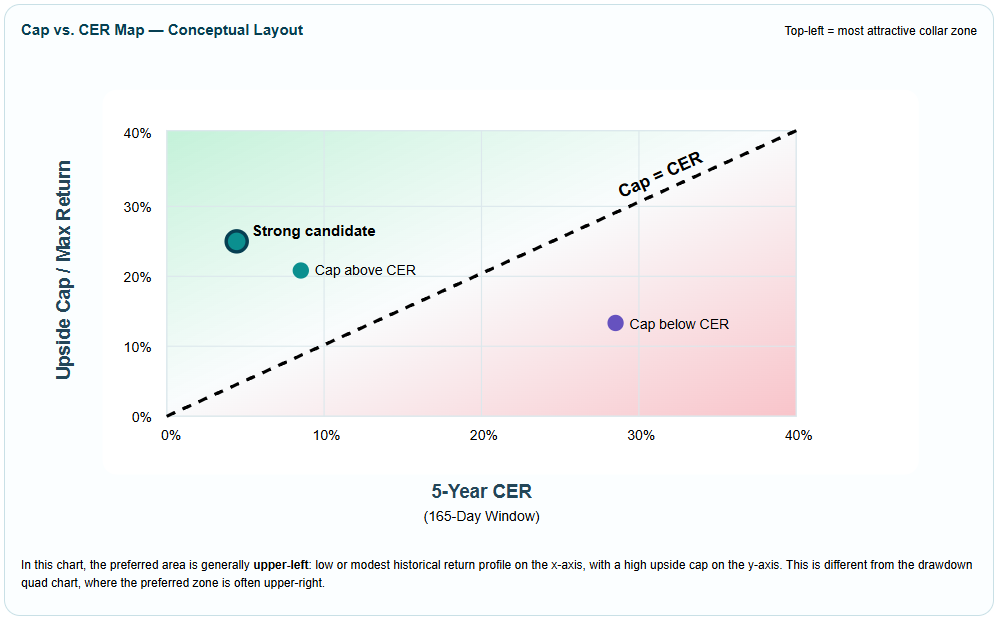
The 17.3% cap compares with a 13.5% CER for the same 101-day window, which is where the 1.3x cap efficiency on the chart comes from. The cap sits above what the stock has historically returned over this period. Going further out raises it: on the 95-80 collar, the maximum return is 23.2% at 157 days, 31.3% at 219 days and 40.1% at 311 days.
If you will hold the downside: the Booster
We have written about Boosters before. A Booster is a 1×2 call overlay on shares you own: buy one call at or slightly above the current price, and sell two calls at a higher strike to pay for it, typically for zero cost. Between the two strikes, every dollar the stock gains is worth two. There is no downside protection. You keep the full risk of owning the shares.
The trade-off is a cap. We call it a soft cap, because it can be managed: if the stock runs through it, the position can be closed and rolled, much as you would roll a covered call.
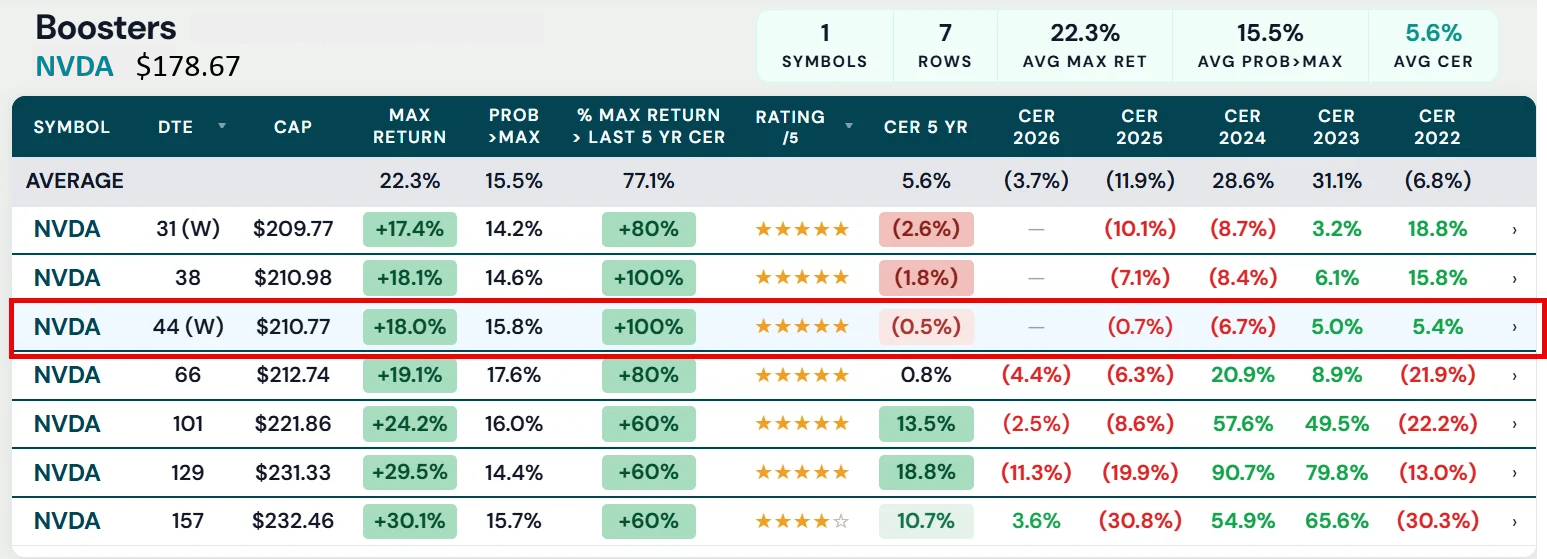
Three key things to focus on: the maximum return at the cap, the probability the stock finishes above the cap, and how often that maximum return would have beaten what Nvidia actually did over the same window in each of the past five years.
The 44-day Booster, expiring December 24, is the one that stands out to us. You buy one $180 call and sell two $195 calls. The cap is $210.77, for a maximum return of 18.0%. That return would have beaten Nvidia’s actual 44-day return in all five of the past five years, which is why it carries a 5/5 rating. The CER for the window is (0.5%).
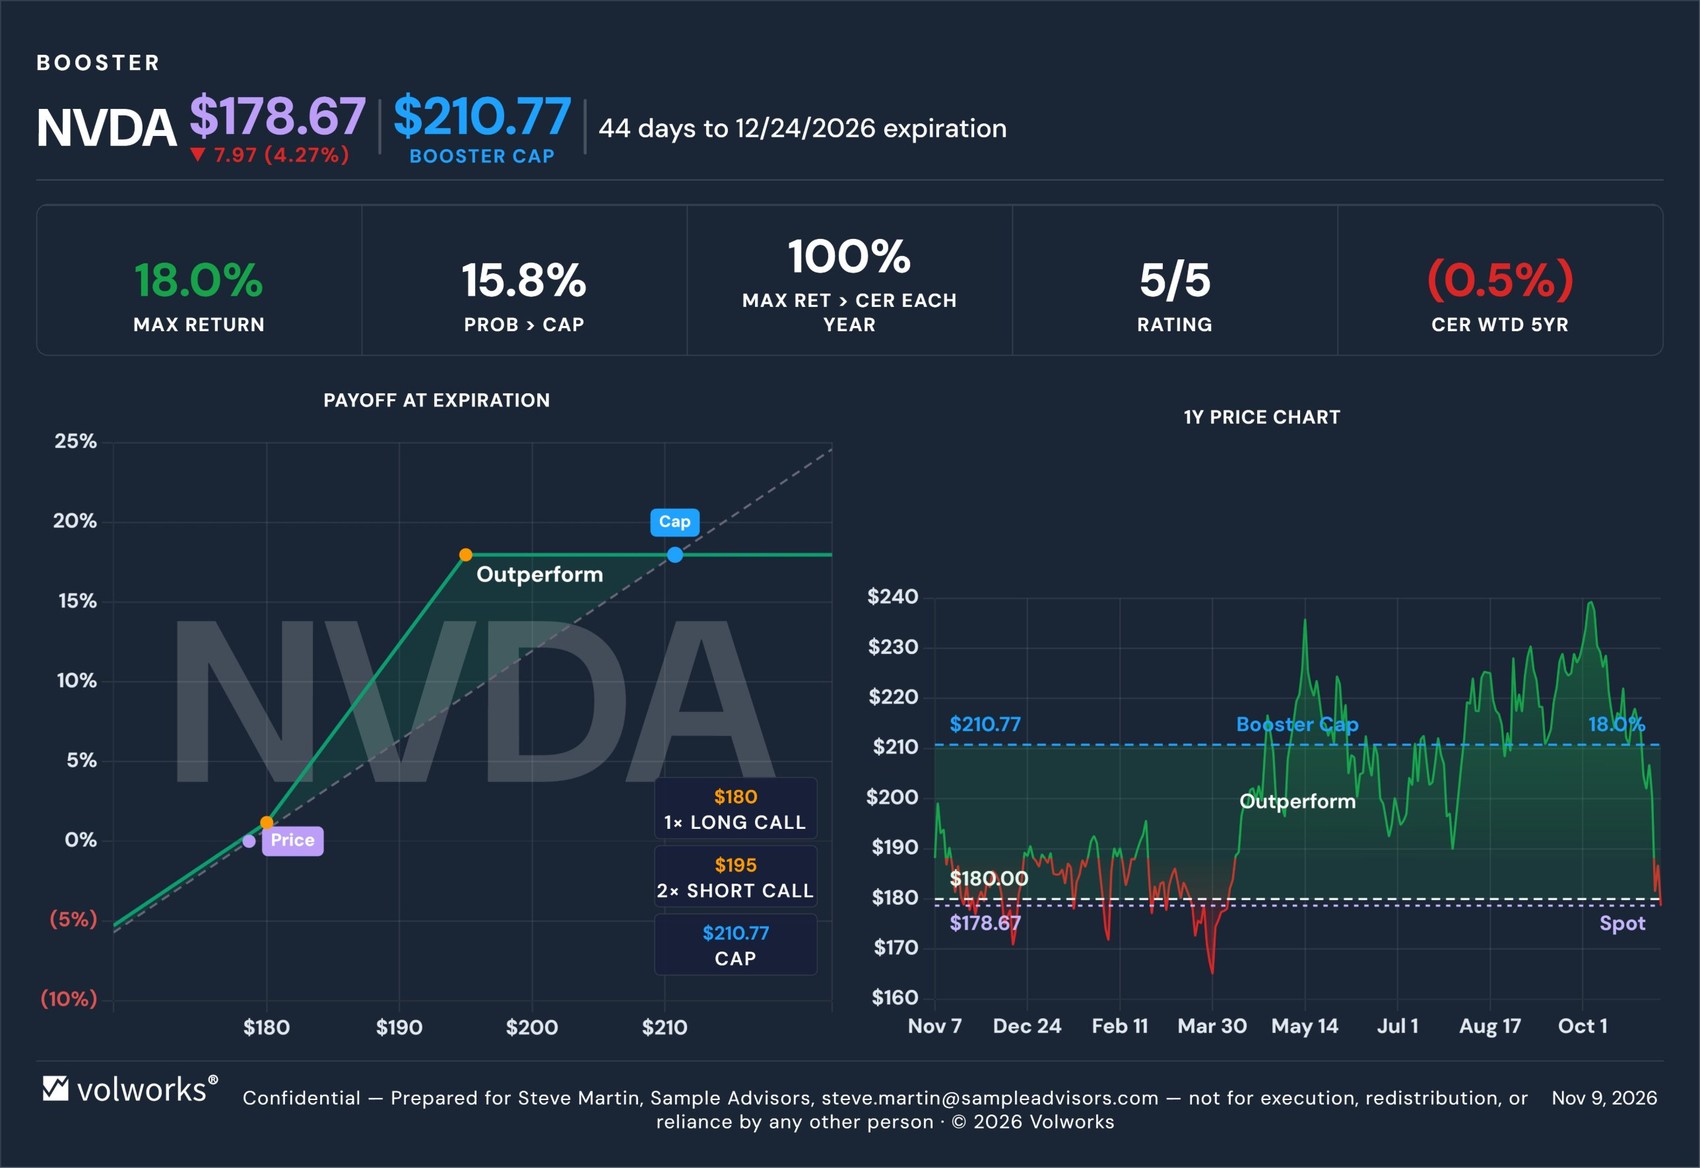
Here is what that means in practice. If Nvidia is at $195 on December 24, the stock is up about 9%. The Booster holder is up 18%: roughly 9% on the shares and 9% on the options. If the stock is up 3%, 5% or 7% instead, the Booster roughly doubles the portion of that gain above $180. From $195 to $210.77 the return holds at 18.0%, still ahead of the stock.
With Nvidia at $178.67, how does a $210 cap sound in 44 days? If the stock does run through it, that is where active management comes in.
We typically run Boosters 80 to 140 days out. Here, the history argues for going shorter. The 38- and 44-day Boosters beat the stock in five of five years. From 101 days out, where Nvidia’s CER has been 13.5% or better, that falls to three of five. If you believe the stock rebounds modestly, or just drifts higher from here, the shorter-dated Booster is the one the history favors.
One caveat: earnings
Nvidia reports on November 17, one week out. Every structure shown here spans that report, and those dated 129 days or longer are likely to span a second one. Option prices tend to be elevated ahead of earnings, which is part of why these caps are as wide as they are. It is also a reminder of how far the stock can move in either direction before any of these trades expire.
The takeaway
There are many ways to use options on a stock you own. These are two that we like and use on our own portfolios. Sometimes we collar. Sometimes we boost. Which one fits depends on your view.
- Somewhat bearish and want protection: the put spread collar defines your loss across a range and still leaves 17% to 20% of upside over 101 days.
- Willing to hold the stock and its risk: the Booster costs nothing to put on and doubles a modest rebound, up to the cap.
None of this is a recommendation to buy, sell or hedge anything. The point is that the options market gives you a way to implement your view, and that the caps, maximum returns and probabilities should be in front of you before you decide. Helping investors make more informed decisions is what every Volworks strategy is built to do.
See it on your own holdings.
Volworks works with RIAs, family offices, institutional investors and self-directed investors. Learn more at volworks.com.
Disclosures: This material is provided for informational purposes only and does not constitute investment advice, a solicitation, or a recommendation to buy or sell any security. Options involve risk and are not suitable for all investors. Past performance is not indicative of future results. Data as of October 26, 2026, from the Volworks platform.
About the author: Victor Viner is Founder & CEO of Volworks. He co-founded Volaris Advisors and founded V2 Capital, both SEC-registered investment advisers, where he served as President and Chief Investment Officer. Volaris ran discretionary covered call programs for family office and institutional clients and was acquired by Credit Suisse; V2 Capital managed a hedge fund, a liquid alternatives mutual fund, and separately managed accounts. He has over 25 years of institutional derivatives experience.